Cost Efficient Candidate Deduplication In RecSys
Andrei Manakov,Ashish Mishra,Pawel Obrepalski18 Feb, 2025

Introduction
The primary goal of a recommendation system is to identify and deliver the most relevant content for a user. To achieve this, it must not only identify high-quality content but also ensure diversity by filtering out posts users have already seen. Deduplication plays a crucial role in this process. Without it, users would encounter repetitive recommendations, leading to a poor experience.
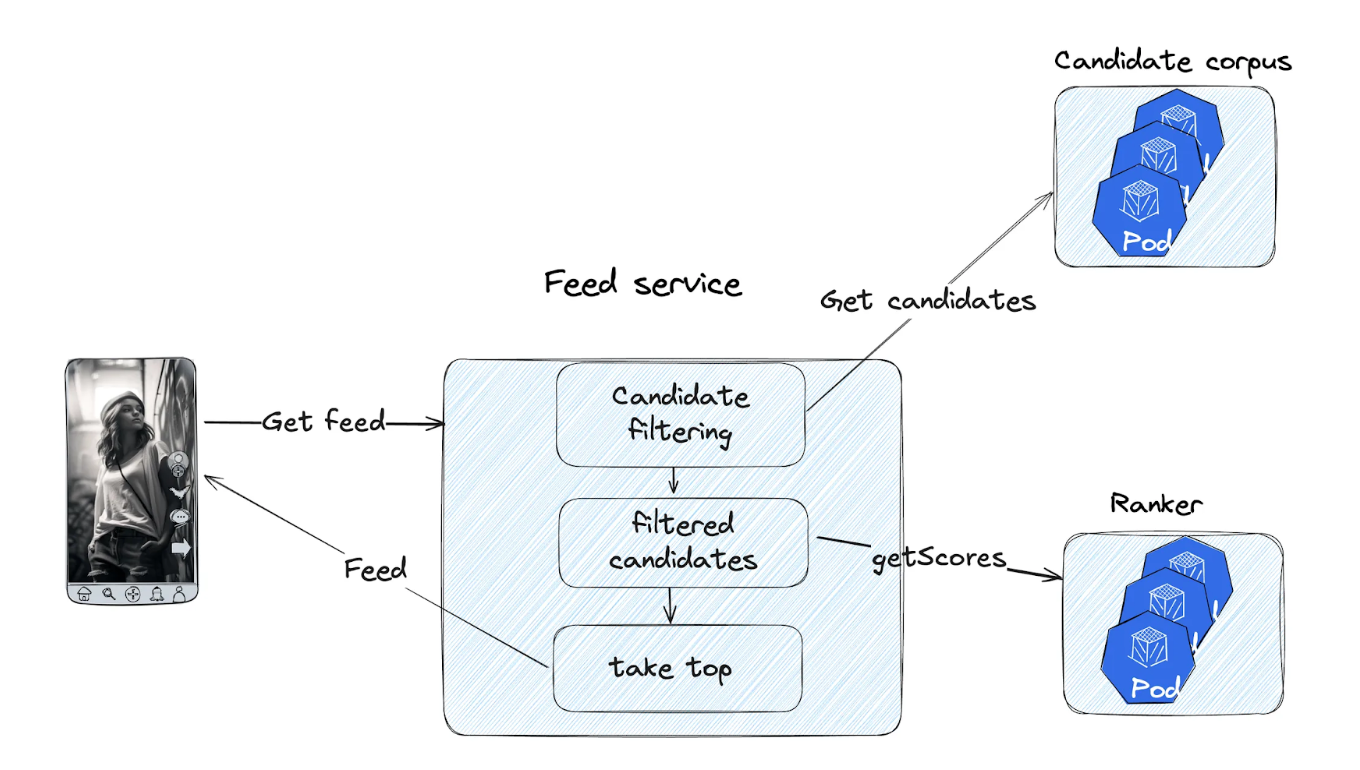
Deduplication is a standard step in the recommendation flow:
- Retrieve candidate posts.
- Filter out candidates based on various criteria, including previously seen posts.
- Score and rank the remaining candidates.
- Return the top results.
Moj and ShareChat serve over 325 million monthly active users who upload millions of posts daily and request tens of millions of posts per second. Making deduplication performant, reliable, and cost-effective at this scale is challenging. This became even more critical as we focused on company-wide server cost reduction. Despite all these challenges, we managed to reduce the cost of the system by 90% without affecting the user experience. In this article, we’ll break down our system design and the optimisations that led to this massive cost reduction—without compromising user experience.
Initial state
There are two important concepts in our deduplication system:
- Viewed posts refer to content the user has seen. We can define it as the last M posts viewed by the user in the last N days.
- Sent posts refer to content recommended to the user, regardless of interaction. We can define it as the last M posts sent to the user in the last N hours.
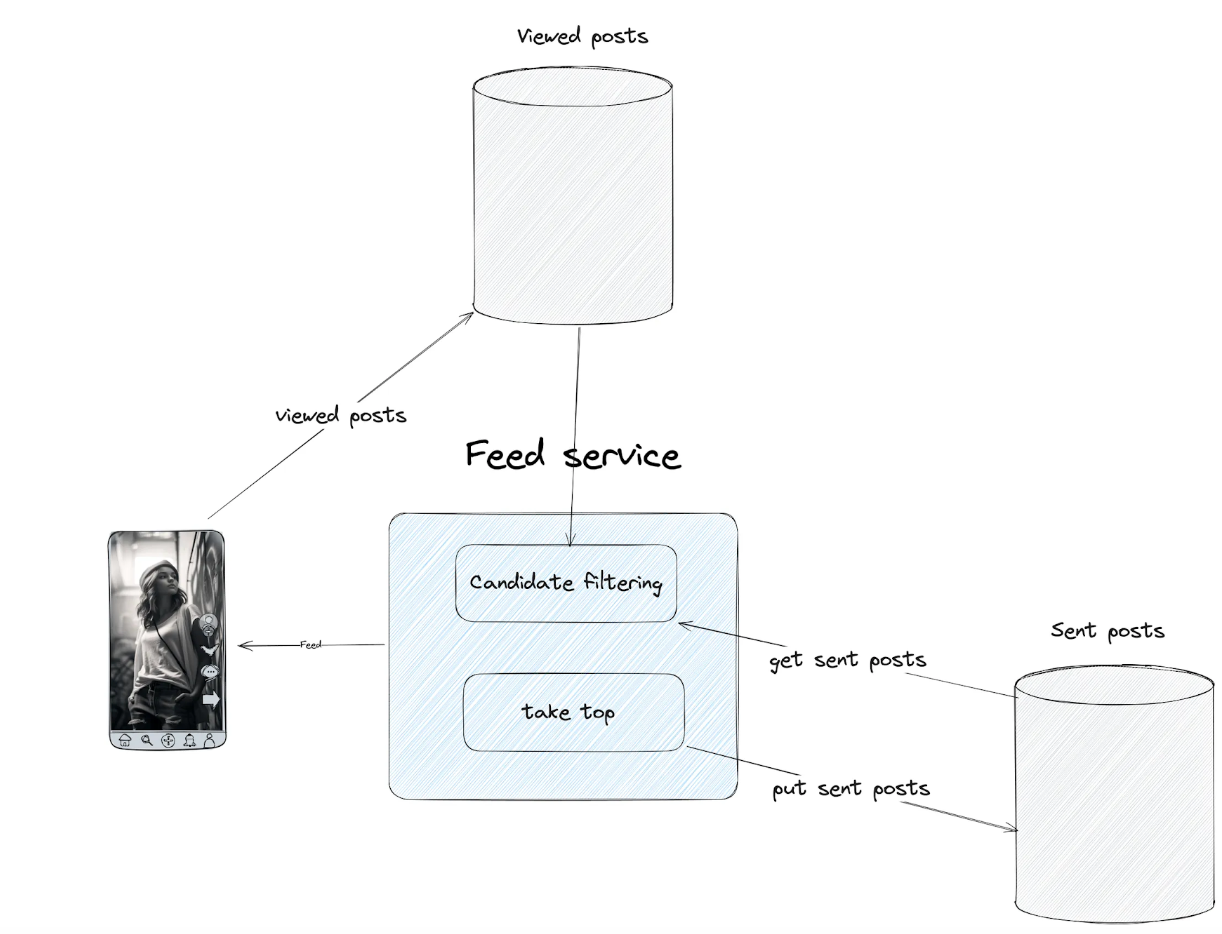
During candidate filtering, Feed Services fetch both sent and viewed posts to exclude them from the response (final feed).
Why do we need both?
Viewed posts are tracked on the user’s devices and then periodically sent to our backend for storage. This is long-term storage, which can contain hundreds of thousands of entries per user. Such events are received and processed with some delay as they are sent from user devices and processed in several queues. If we relied only on viewed posts, duplicates could appear in sequential feed requests.
To address this, we also store sent posts which are saved before being delivered to the user. This eliminates delay and ensures no duplicates on subsequent feed fetches.
Why don’t we use sent posts exclusively?
A feed response contains multiple posts, but it is not guaranteed that the user will view all of them—they might close the app or refresh the feed. Relying only on sent posts would mean excluding highly relevant and unseen content, which could negatively impact the quality of the feed.
Components
Initially, the system was developed relying heavily on the Google Cloud. Here's how the system was initially designed:
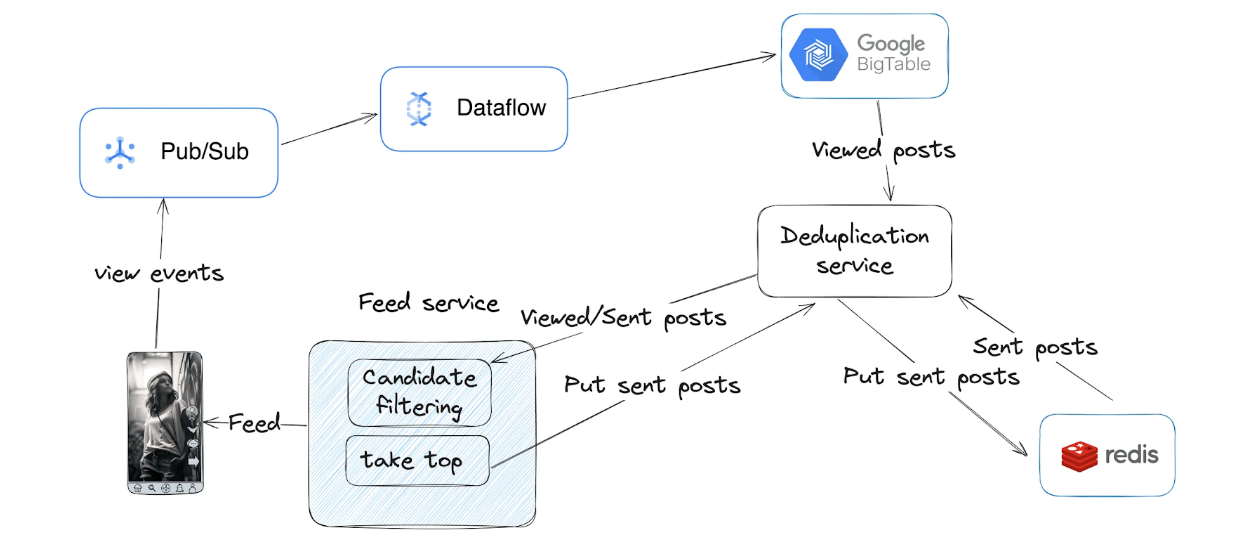
Journey of Viewed Posts:
- Sent from the client and placed into a Google Cloud Pub/Sub queue.
- Google DataFlow job aggregated events by a user over a time interval and wrote to Google Bigtable as separate rows.
- The list of viewed posts was stored as a single string within a cell, formatted as: "postId1,postId2, ...”
- Garbage collection policies were used to limit the number of rows and time to live (TTL).
Journey of Sent Posts:
- When the feed-service returned recommended posts, it simultaneously stored them as sent posts.
- Sent posts were stored in a Redis queue for a user, implemented with a linked list using the following commands:
- RPush - add a new post in the list after sending a post in the feed response.
- LLen - check the queue size before inserting.
- LTrim - remove last elements from the queue if size exceeds M.
- TTL was set to the entire queue and refreshed on every change. The sent posts expired only if a user was not sent any new posts over the TTL duration.
Optimisations
While the system worked and empowered our feeds for a long time, it was quite expensive and error prone, prompting us to optimise it. Additionally, we used cloud-specific technologies, making it difficult to control or accurately predict the cost of most components as cost is fully controlled by a cloud provider. We decided to reduce system costs gradually. We also aimed to make the system cloud-agnostic, reducing reliance on any single provider’s pricing model.
Cost effective infrastructure
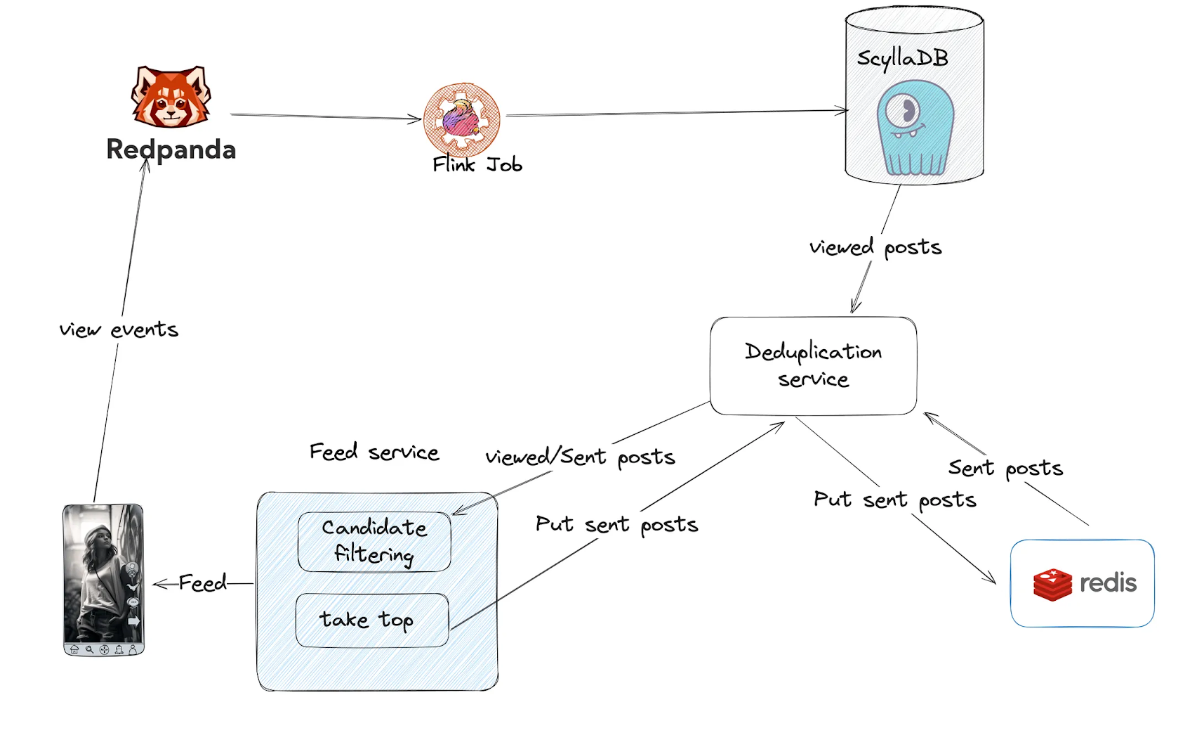
As the first step of our cost optimisation journey we focused on reviewing the technology stack and replaced the components with alternative cloud-agnostic solutions. By then, we knew these alternatives could be both more performant and cost-effective. Additionally, making our system fully cloud-agnostic allows us to move to a different cloud provider without significant changes to the product.
Pub/Sub→RedPanda
We chose RedPanda as our new event queue as we had already proven that this technology is reliable and cost-efficient. It’s a fully Kafka-compatible product, which means it can be easily integrated anywhere. Written in C++ with a thread-per-core architecture, it is highly efficient. In our use case, queue costs were reduced by ~66%.
BigTable→ScyllaDB
ScyllaDB is a Cassandra-compatible database written in C++ with the same thread-per-core architecture. We already had multiple use-cases where it had proven to be a reliable and cost efficient technology. Our Database cost has dropped by ~60% after switching from BigTable to ScyllaDB.
DataFlow→Apache Flink
Apache Flink is a proven and powerful technology we have already leveraged for our feature store. This provided the largest cost reduction, cutting streaming costs by ~93% compared to Google Cloud Dataflow. It’s also worth mentioning that Apache Flink supports autoscaling.
Each component was replaced incrementally, ensuring minimal disruption and allowing the migration to be completed without major data schema changes.
Product-Driven Optimisations
Systems typically have well-defined problem statements and key metrics—user engagement in our case, measured by videos watched, post likes, shares, etc. Unfortunately, that is not always the case. It is not uncommon for a software engineer to find numerous parameters in the code and legacy logic that may not be relevant anymore. To achieve cost-efficient and performant software, we shouldn’t hesitate to question every single parameter and clean any unclear code! Often, the best approach is to launch well-designed A/B experiments to measure actual user impact.
For example, we found that content duplication can sometimes boost user engagement, revealing a more complex relationship than expected. We’ve launched dozens of A/B experiments to help us fine-tune various parameters, reducing the load on certain components by 2-3x, and cutting tail latency by up to 4x. In this section, we’ll illustrate a couple of examples.
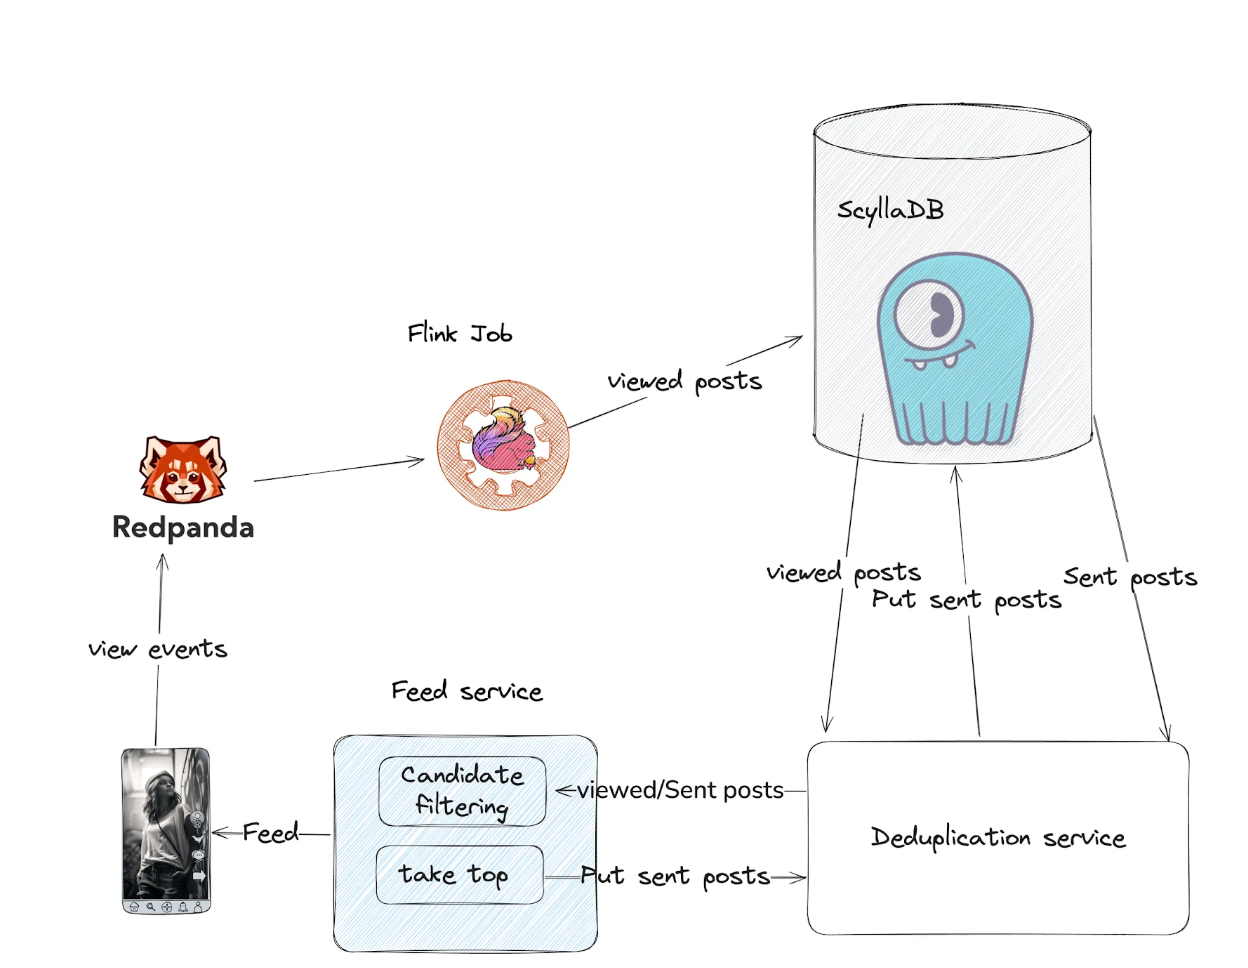
Our Apache Flink job subscribes to view events, aggregates them over a defined time window, and writes a batch of posts into a single row. ScyllaDB is an LSM-based database optimised for writing, making it perfect for this task. You can see the table schema below.
This schema is optimised for retrieving last M rows with the user’s posts (where time > now - N days) as all rows are stored in a single partition.
1 2 3 4 5 6 7CREATE TABLE viewed_post ( user_identifier text, // Partition key time timestamp, posts text, //"post1,post2,post3" PRIMARY KEY (user_identifier, time) ) WITH CLUSTERING ORDER BY (time DESC) AND default_time_to_live = 7776000 // 90 days
A partition is a unit of data storage, and ScyllaDB distributes data across the cluster using partitions. The fewer partitions are read during a query, the better the performance.
This raises key questions: How many days of data do we need? How many rows should we use for deduplication? After all, no one would notice a duplicate among 50,000 posts, right?
These questions can be answered by running A/B tests. We found that reducing TTL from 90 days to 30 days did not negatively impact user experience, while reducing the required SSD storage by 66%. Since SSDs account for a significant portion of costs, this was a valuable optimisation. Additionally, reducing data size lowered CPU usage across the ScyllaDB cluster.
ScyllaDB uses all available resources, as I mentioned earlier. With respect to memory, it means that it uses all available memory for internal cache. and with less data size, more requests will be served by the cache without additional disk reads, and hence less CPU usage.
Even better, we managed to reduce the number of rows as well. This led to a reduction of deduplication service P99 latency from 30-40ms to 6-8ms along with CPU reduction in whole flow by less marshalling/unmarshalling. By simply questioning and adjusting system parameters, we improved system metrics without degradation in user experience.
By systematically questioning and tuning system parameters, we improved efficiency without compromising user experience. We reduced requests per second (RPS) to the deduplication service by 3x and simplified the system without negatively impacting our users!
Storage Optimisations
Optimising how we store the data was another important aspect as it had two benefits:
- Performance improvement: Smaller entries improve cache hit ratio as we can fit more rows in the fixed size cache. A higher hit ratio reduces disk reads, lowering both latency and CPU usage.
- Cost reduction: Database costs primarily stem from SSD storage and compute resources. Smaller data size means fewer SSDs needed to hold the entire dataset and lower CPU requirements as most of the reads hit cache, reducing overall costs.
Viewed posts made up the bulk of our ScyllaDB storage, making them the first target for optimisation. The challenge was choosing a compression approach that balanced compute overhead, code complexity, and storage reduction. We experimented with several approaches including bloom filters and roaring bitmaps, before adopting delta based compression.
Bloom Filters
Bloom filters are space efficient probabilistic data structures used to determine if an item is in a set of elements. Our use case is finding a given postId in a set of already viewed postIds. Bloom Filter is a standard choice for such use cases. We initially estimated a 60-80% reduction in storage but encountered several drawbacks:
- They are probabilistic in nature and can return false positives. This means, even those postIds that are not sent or viewed by the user could appear as found in the filter. It might lead to unseen posts being filtered incorrectly. Although at the cost of increase in the bloom filter size we can set the desired false positives probability, it can never be zero. For example, check this playground to understand the relationship between number of total posts, desired false positive probability and relevant number of hash functions.
- Viewed Posts are stored not in the original form of strings but as in a binary representation which is difficult to parse back. For example, postIds are hashed using multiple hash functions and accordingly the bits are set in the index. However, given the set bits in the index, it is not possible to parse the original posts. Hence in case of any incidents, recovery will be very difficult
- When using Bloom Filters, there is only one way to filter out viewed posts - the clients send the list of candidate posts to filter to the service. Service checks these posts in the bloom filter and only returns those posts not in the filter. Now, the service code must be changed to accept the list of candidate postIds from clients and return those not in the bloom filter. It will require changing contract between client and service and will take a lot of time.
Roaring Bitmaps
Roaring Bitmaps are specialised data structures that offer very fast access and compressed representation for a set of integers. Though conventionally our postIds were stored as strings, they are just sequential numbers and can be represented as int64. Thus, roaring bitmap was considered to help compress viewed posts. We also experimented with adding gzip compression on the top of roaring bitmaps. The observations were:
- Roaring Bitmaps + Gzip offered worse compression (~30%) than the Bloom Filters for smaller numbers of postIds, up to ~200.
- As the number of posts increased, it started performing better ( up to ~70% compression), but fewer than 1% of users viewed enough posts for this to be beneficial.
Delta Based Compression Schema (final choice)
Our postIds are sequential numbers. If we take the difference of the postIds, we are left with much smaller values than the original int64 numbers. So if we keep a reference postId and store other postIds as only the deltas to the reference, we would have a lossless data set with smaller values in general. On the top of this set, if we use an encoding such that smaller values occupy less space, we can significantly reduce the overall size of the dataset. This is what protocol buffers do. They use variants to encode the data and smaller values occupy fewer bytes.
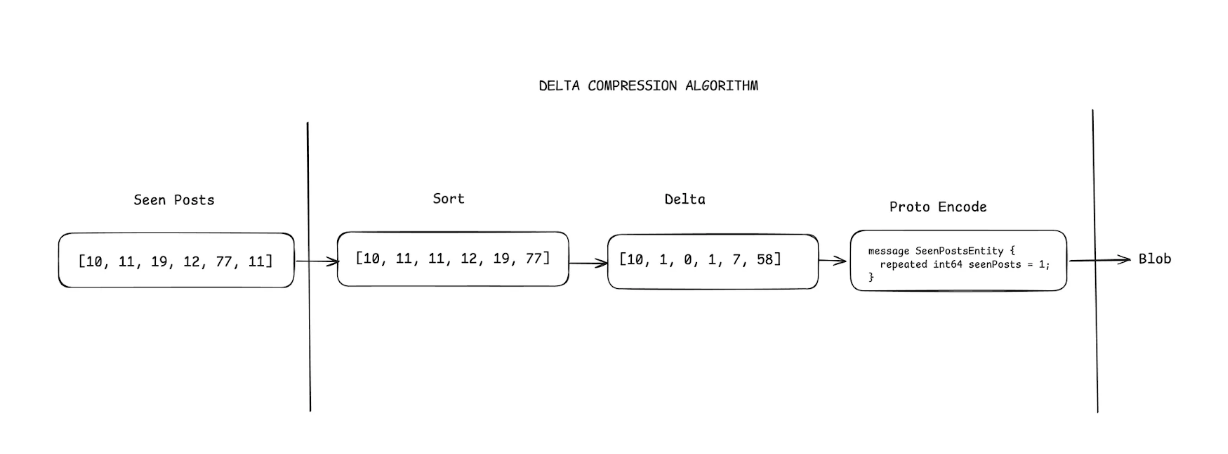
Algorithm:
- Sort post IDs
- Compute Deltas from a reference ID
- Proto Encode for efficient storage
With this approach, we had a slight change in schema:
1 2 3 4 5 6 7CREATE TABLE sent_post.seen_post ( user_identifier text, time timestamp, ***post_ids blob**,* PRIMARY KEY (user_identifier, time) ) WITH CLUSTERING ORDER BY (time DESC) AND default_time_to_live = 2592000 // 30 days
Adopting delta based compression schema saved 60% of storage and 25% of CPU with minimal added complexity.
We also found that layering additional compression (e.g., gzip) on top of techniques like Roaring Bitmaps or Protocol Buffers only provided significant savings when the data size was large. For example, gzip compression became beneficial only after 600+ posts per row.
Looking ahead, if we increase the number of posts stored per row in Flink, adding gzip compression on top of Protocol Buffers will be a logical next step.
Sent Posts Optimisation
After optimising how we store viewed posts, we turned our attention to sent posts handling.
Initially, sent posts were stored in Redis. Each new post list was appended to the existing list for a user, with older elements trimmed to maintain a fixed size (N). A TTL was applied to each key, ensuring that inactive entries were automatically deleted after a set duration.
We considered moving sent posts to ScyllaDB for three key benefits:
- Cost saving: Redis cost for compute and storage was higher than Scylla with compression. Our delta-based compression significantly reduced storage and compute requirements, making the cost nearly negligible when compared to viewed posts.
- Efficient expiry handling: ScyllaDB has a
gc_grace_secondsparameter configurable at the table level. When any row’s TTL expires, ScyllaDB checks the cell timestamp plusgc_grace_secondsvalue. In case this value is less than or equal to the current time, no tombstones are created and thus expired data is truly removed from the DB quickly. The default value ofgc_grace_secondsis 10 days. But for our case, we set it as the TTL value to avoid generating any tombstones. - Simplified Architecture: Now we had a single DB storing both types of posts, which reduced the required number of calls and complexity of each request.
One issue was uneven partition distribution—certain hot keys (mapped to users requesting more feed fetches) received significantly higher traffic than others, creating Large Partitions. This caused higher load on the shards/nodes holding those partition keys while overall cluster load is small.
We were aware that such a problem might occur and chose a simple fix: limiting the number of requests for such keys. This introduced minor data loss and occasional duplicate posts for certain users, but we found this tradeoff acceptable.
Don’t waste your resources
Optimising resource allocation is crucial, but in practice, it's more complex than it seems. While it’s clear that we shouldn’t allocate more resources than necessary, increasing CPU utilisation can cause latency spikes, while reducing available memory may increase garbage collection (GC) pressure. These optimisations must be approached carefully and require a deep understanding of the technology and overall system.
Here are a few things that worked for us:
- Horizontal Pod Autoscaler (HPA): We ran several experiments to gradually increase the target CPU value. In this case, the transition was smooth with no latency impact. However, for other services, we had to tune GC parameters and reduce mutex contention.
- ScaleOps: We have onboarded the deduplication service to ScaleOps - it provided us with right-sizing suggestions which we then applied.
- Apache Flink autoscaler: Adjusted the autoscaler in the Apache Flink allows us to better utilise our resources. As this can lead to lag spikes in streaming jobs, it should be done carefully as well.
ScyllaDB was already significantly cheaper than Bigtable (BT). However, after diving deeper, we realised that the cluster size could be reduced even further without performance degradation. ScyllaDB is optimised to utilise all available resources, allocating free CPU cycles for maintenance tasks. Since these tasks don’t impact real-time performance, they should be excluded from capacity analysis.
We covered this in depth at the ScyllaDB Summit – check out our talk and blog post for more insights.
Network Cost
Cloud providers offer multiple availability zones—physically isolated data centers within a cloud provider's infrastructure. For a system to be highly available, its components are usually deployed across more than one availability zone. This ensures that in the event of a catastrophic failure in one data center, the second data center remains operational, preventing system downtime. However, this setup is costlier to operate. Traffic between zones (Inter-zone) incurs additional charges, which can have a significant impact.
Redpanda
To reduce inter-zone traffic, you can leverage the follower-fetching feature, which enables data fetching from brokers within the same zone.
ScyllaDB
The token-aware policy ensures that the ScyllaDB coordinator node contains the desired shard, reducing internal traffic within the ScyllaDB cluster. The rack-aware policy ensures that an application connects to a node within the same availability zone.
Kubernetes
There are multiple options to reduce inter-zone traffic between Kubernetes applications. The simplest approach is to configure topology-aware routing, which can reduce such traffic by 80–90% using a best-effort strategy. Later, we adopted and built our own service mesh solution based on Envoy Proxy, achieving 0% inter-zone traffic.
Deduplication service optimisation
As the last big bucket, we looked at optimising the deduplication service. It is aGolang service hosted in the Kubernetes cluster. The most impactful optimisation was choosing the right technologies again. The most cost efficient solution is to use the spot provisioning model. However, availability is not guaranteed and the pods can be evicted. The solution which helps us here is CAST AI. It helps to schedule spot nodes when they are available and on demand ones as backup. Obviously, we can’t use such a solution for the Database and Queue, but it works nicely for stateless applications.
We also implemented two key optimisations to reduce memory and CPU usage:
- Optimised garbage collection: tuning
GOGCandGOMEMLIMIThelped us reduce CPU usage by ~6%. - Replaced default JSON encoding/decoding by Sonic. It uses JIT (just-in-time compiling) and SIMD (single-instruction-multiple-data) and is usually several times faster than the standard json library. In our case, it reduced overall CPU usage by another 5.8%
Results
Building a scalable and cost-efficient deduplication system is not just about cutting infrastructure expenses—it requires a deep understanding of system behavior, workload patterns, and optimisation opportunities. At Moj and ShareChat, we tackled this challenge by simplifying our architecture, adopting the right technologies, and continuously iterating based on real-world performance. Over the past year, we reduced the system's cost by 90% while improving latency.
Cost optimisation is often seen as a tedious task, but we completely disagree. It’s a pure engineering challenge - a process of identifying and removing bottlenecks without compromising on reliability and service quality.
Lessons Learned:
- Simplicity Drives Efficiency: A simple and clear system is often the most performant and cost efficient. Always question your assumptions and run A/B experiments when in doubt.
- Technology Choices Matter: Choosing the right technology is crucial for building a cost efficient system. We switched multiple components to better-suited alternatives, reducing costs while mitigating cloud pricing risks.
- Optimise for Specific Use Case: It is imperative to understand your own use case and optimise for that. For example, our homegrown delta based compression algorithm beat already existing, proven methods for storage reduction.
Our journey highlights that efficiency and performance don’t have to be trade-offs—with the right approach, it's possible to achieve both. These learnings extend beyond deduplication; they serve as guiding principles for optimising large-scale distributed systems across various domains.
If you’re working on a similar challenge, our key takeaway is this: question every assumption, measure everything, and optimise relentlessly. 🚀