Making Tracing as a part of Engineering DNA

Asadh Sheriff19 Jul, 2021



At ShareChat, with enormous growing business dynamics and increasing MAUs & DAUs, we have started focusing not just on building great engineering solutions that solve best for the requirement with optimal cost utilisation.
Frugal innovation is one of the most critical emerging models of value creation for both businesses and the customers they serve.
— Frugal Innovation: How to Do More with Less

Within the platform team, we wanted to build solutions to understand the performance and response of how 10000’s CPU cores & RAMs are utilised by 100’s of microservices under various circumstances. Although we have our microservices been integrated with Prometheus & Grafana to witness bottlenecks and health of our resources, they are not just enough to take intuitive automated actions on top of them apart from alerts. We wanted in-depth observability and monitoring metrics from every single resource on ShareChat’s network and deduce meaningful insights.
Tracing Philosophy Used
We used philosophies of open tracing for extracting various metrics from every single resource and collected Externally to create actionable items and build more intelligent infrastructure for rate-limiting, scaling, calculating HAUs, DAUs, etc.,
Opentracing is a standardised concept of tracing and instrumenting which offers visibility of how each request entering the ShareChat network navigates across multiple distributed resources while serving the request. Opentracing does not just provide visibility but also the mechanism to monitor, track and instrument more intricate detail on each request.
High-level Tracing Architecture
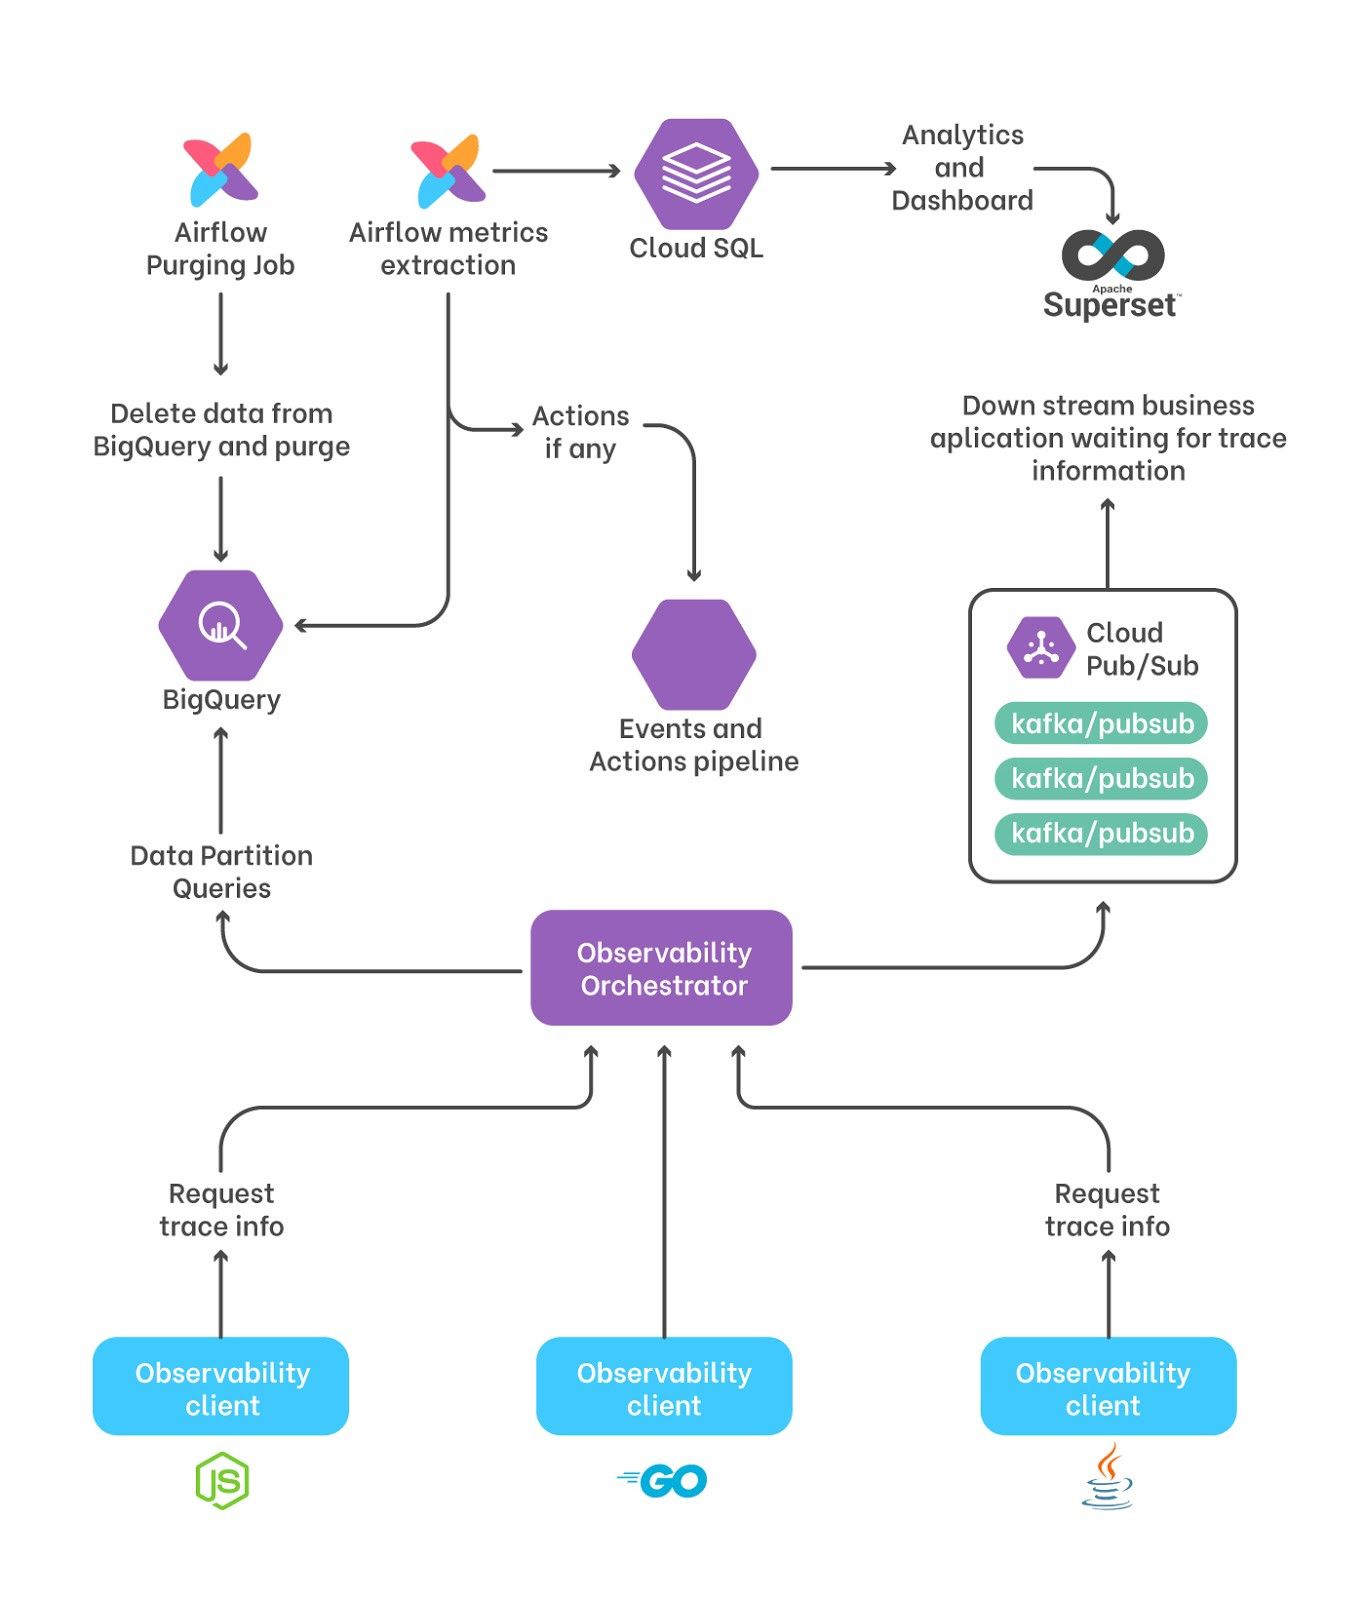
We built an ever-maturing architecture to support the multitude of complex and here is our Architecture,
Sequence Flow
Observability client is an easily pluggable library with any service or resources to enable tracing. For the purpose of comprehending, we have assumed that Observability client has been integrated with all of ShareChat’s services in the below flow
- Every incoming request is intercepted by the Observability client and amend a few tracing context & metrics. These are recognised by other Observability clients when the same request gets processed in other services or resources to serve some data.
- These contexts are transferred to our external Observability Orchestrator regularly to extract insights, for example, connect all the context of the same request to understand the traverse path and potential bottlenecks causing a delay. However, there are few metrics which is local to Observability client handles itself for deriving insights, for example, rate-limiting counters, rate-limiting configuration, external orchestration sync up, etc.,
- Once the data is fed into Orchestrator, it’ll generate a Graph with context & metrics on each node of the graph and do two things,
1. We use PubSub to publish events to downstream business services which rely on this trace data, for example, our overall DAU, HAU metrics calculation, Service Dependency graph(like Neo4J) module, etc.,2. Feed data to BigQuery for running analytics on top of it. However, we’re also working on use case-specific DB’s to take advantage of their own, for example, Dependency Graph generation of all the resources can be stored in SQL.
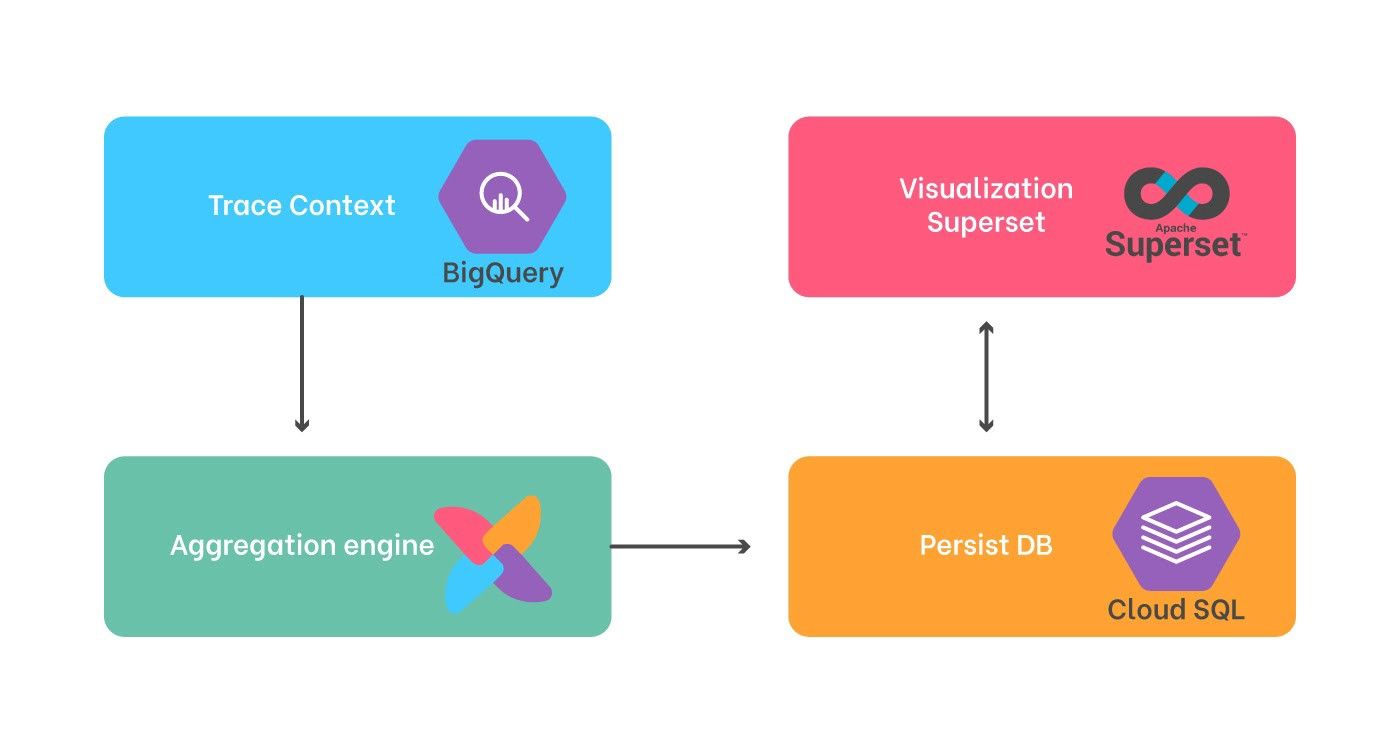
- We have multiple complex and periodic workflows on top of BigQuery to generate analytics, alerting data points that can be fed to the Events pipeline of ShareChat. Apache Airflow enables to achieve this by leveraging EventTrigger and Schedulers.
- Our platform & many other teams need visualization of the data points, internally we use Apache SuperSet as it is feature-rich and is easily pluggable with most of the GCP resources without brainer
Challenges of Building
Although it looks relatively simpler to build the above architecture, it comes with a lot of complexity & challenges in building a fully functional solution. The complexity of the problem increased with the untold scope of us building a solution to accommodate future requirements. On the flip side, the challenges of building a solution were multifold and they are mainly around how to provision CPU efficient, memory-efficient & network efficient solutions.
Here’s the load we handle at ShareChat, 2.4 million RPS on a normal day, which gives,
# requests/day(RPD) = (2.4 * 10⁶) * (60 * 60 * 24) = 20.736 * 10¹⁰
Further, let’s breakdown the problem to understand infrastructural and cost requirements to deduce the size of the problem we are dealing with,
- Easy to plug client to any resource: One of the challenges in building language-agnostic libraries is, making it as thin as possible and as auto configurable so that other developers don’t have to feel like carrying big baggage in their application containers.
- CPU requirement: For the traffic of 2.4 million requests, we need Observability Orchestrator scaled to handle 2.4 million requests per second. On average, if one pod can handle 1.5k-2k requests per second, then we need close to 14000 pods😳.
- Memory requirement: On average, our trace context is 100–150 bytes which amount to 21 to 30 TB of data per day. We are not just dealing with the size of data here, but we need storage that can handle close to 2.4 million write operations. Just to give you a picture of how much it would cost, here is Netflix’s benchmarking on scaling Cassandra for higher operations for a bigger size of data. We would have built one of the most expensive storage rigs for our use case if we did not optimize it for our case.
- Network requirement: For the above throughput, our network ingress is averaging between 150–190 Mbps and egress based on the frequency of data readout.
Here is how we optimized our architecture…
Pluggable client libraries:
Every language has its advantages manifested to unveil in the compatible environment, so providing a library that looks uniform from the consumer point of view, but what is built underneath has its language-specific challenges to achieve the same level of Auto-configurability and feature extraction. Let’s take an example scenario here,
In Opentracing we use request or thread context to propagate trace information of an incoming request to its whole call hierarchy so that the context can be propagated to another service for the requests originating from the current service. Although it is achievable in Spring/Java using ThreadLocal, it is difficult to achieve the same in NodeJS due to its obviousness of single-threaded architecture. Just like many other companies LightStep, Netflix, we used the self-provisioned experimental version of Async Hooks with multiple wrappers around the same.
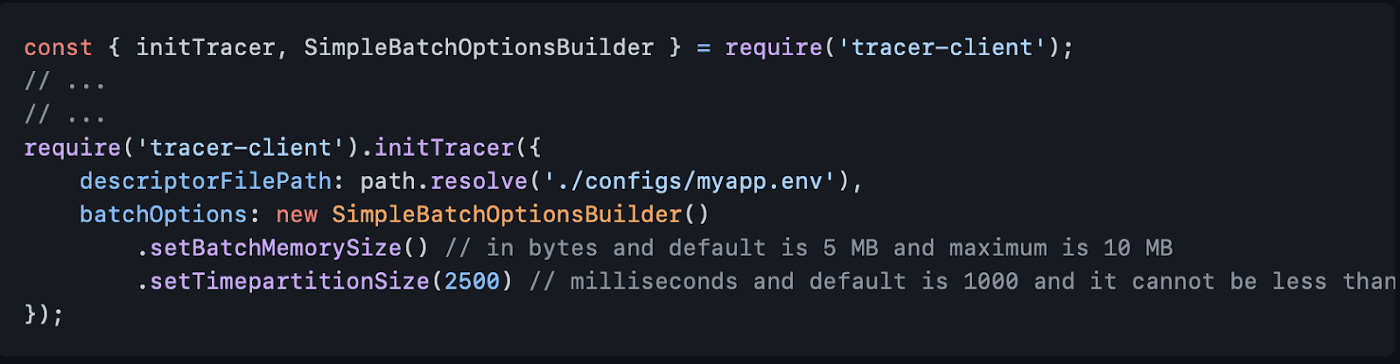
We had to build a robust, thin wafer library that encapsulates computational complexities of processing a request focusing primarily on not increasing the request-response latency negligible(~10ms). Here’s a sample code to boot up our tracer-client library which we have written in NodeJS.
Processing Optimization
It is CPU intensive to process 2.4 million RPS, however, we developed a cost-efficient solution leveraging the idea of segmenting data into categories, data points needed at real-time (no delay) basis, and data points for a non-real-time use case. Further, we broke down this problem into data to be processed synchronously & asynchronously that consequently help us decide the priority of CPU, memory choices used by our Observability Orchestrator. For example, we cannot use our REDIS power for tracing every single request in real-time for the data of size 21TB a day or use simple SQL for real-time processing of rate-limiting counters.
With the above strategy, we reduced the no. of server hits to our external Orchestrator by 60% which in turn reduced our CPUs from 60 to 25 on the orchestrator side.
Memory & Cost Optimization
The requirement for storage is eccentric in a way that we need storage to handle high volumes of Write Ops and reasonably faster reads for large volumes in one go. For the given constraints we can use horizontally scalable MongoDB or Cassandra, but with a degraded performance on reading bulk data and running some aggregation on top of it.
We ran some benchmarks for our use case to figure out memory performance and cost on different technologies. To handle intense writes per second for such large data, Google’s BigQuery(BQ) was the right fit for performance and cost ratio. In BigQuery all of the inserts are guaranteed and not attributed to billing costs. However, the size of the data chunk being queried out of BQ is billed. Let’s take a look at an arbitrary example in getting some aggregates,
SELECT sum(any_attribute) from trace_log
WHERE service_name = `service_1` AND start_time >= ‘2021–06–05’
AND start_time < ’2021–06–05’
For a service having 75K requests per second, it will be close to 650GB of data which will be processed per query and that’s a huge amount of data to query and also a big amount on billing based on the frequency of run.
So we used time-based data partition techniques along with indexes to reduce the size of data partition read to 1.8–2.2GB. The cost to run a query is directly proportional to the size of the data partition getting used. Hence, we leveraged this for our use and solved most for our use case.
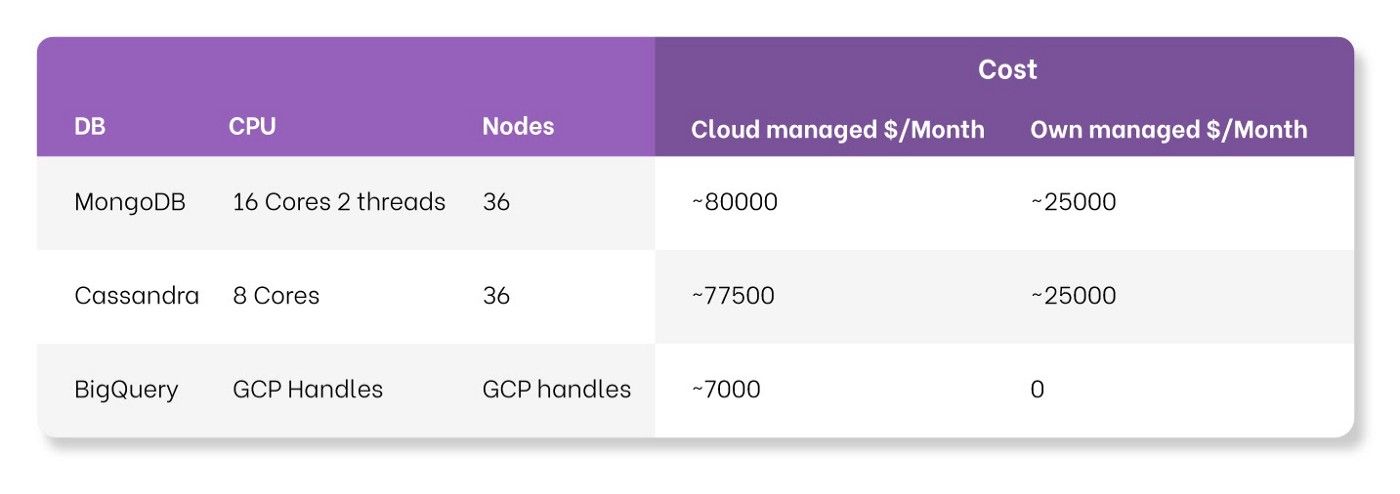
We leverage multiple technologies to their best use case in our Architecture, for example, SQL is used to store all of our Aggregated data which is read out in Apache Superset. Although BigQuery solves the majority of use cases, we have been thinking of using Cassandra/BigTable/ScyllaDB for various specific use cases as the very nature of these technologies supports operations & cost efficiency over BigQuery .
Network Optimization
The cloud-managed solutions usually come with ingress & egress network cost which adds more complexity to acquiring optimisation on network footprint. Observability Orchestrator alone handles close to average ~170MB/s. As observability clients are internally developed libraries, we could use gRPC combined with Protobuf to increase the throughput by 65–80% on average.
After this optimization, we are also trying to delegate the load from the central orchestrator to the client library based on Service Mesh Architecture. The Service Mesh Architecture is a powerful way of imposing observability, metrics extraction, and increasing the reliability to applications by inserting these features at the platform layer. This also gives the platform and edge servers to have more control over the network to optimize network footprint in all ways
What did we achieve?
In addition to giving visualization of request trace in a distributed environment, we’ve started building more observability & business use case modules out of the data that is being collected. Here are some,
DAU metrics & HAU metrics
In our trace context, we also collect user identity information. In one of our business use cases, we had a requirement of tracking Daily Active Users(DAU), Hourly Active Users (HAU) calculated across all the resources and attribute a cost($) associated to each user. We have built this calculation pipeline and we have it running in production with a minimalistic operational and memory footprint.
Pod level rate limiting infrastructure
In a distributed environment with 1000’s pods running under a microservice, we are falling into a situation where our pods of being bombarded with more than the requests that it could handle resulting in an unresponsive pod leading to increased latency caused by other failing pods and time for the load balancer to auto-scale more pods to mitigate this. Currently, we are building an infrastructure that will enable pod level rate limiting per contributing service, so the one load contributing culprit will not be penalizing the overall health of a pod that is serving other services. This infrastructure is going to be orchestrated centrally and executed primarily by our lightweight observability client library.
Automatic Network protocol adaptation with Proxy
In ShareChat we have a mix of endpoints exposed over the network using HTTP(s) and gRPC. It is challenging to enable interoperability between services accessing endpoints exposed over gRPC and vice versa. With the power of our Client library as a sidecar, we would be able to build proxies to enable Transcoding of protocols without other developers having to worry about which are the endpoints a service can access via HTTP(s) and gRPC. The transcoding infrastructure would be API aware with an optimized network footprint and powering our developer’s experience even better without being restricted by technology constraints. Here is what we’ll be trying to achieve in our future builds of this project.
The potential of our infrastructure is boundless that the list of things we could build on top of this to solve more engineering problems is never-ending :) To name some, circuit breaker at a pod level, request failure auto-retry and recovery mechanism, etc.,
I’ll be writing list of metrics or platform solutions we built from the data insights we extracted using tracing in the coming series of blogs in Tech @ ShareChat