Streaming Aggregations at Scale
Shubham Dhal5 May, 2022

Written by Shubham Dhal
Being a social media company we maintain a lot of counters; from views, and likes to many more internal ones related to revenue spends etc. Updating a count might seem simple but as always the real problems come with scale. If your mind instantly went to thinking about concurrency issues, load on the database, hot-spotting, costs etc then you are possibly thinking in the right direction.
Operating at the scale of ShareChat+Moj often we need to handle 100k+ updates per second per app. This was causing problems for us as our KV stores were getting unstable and we saw latency spikes. There were severe hotspotting issues as well.
Thus we wanted to build a solution which will not only solve our present issues but also ensure that we are ready to handle 10x the present scale if not more. Below we try to detail the solution we built out using Kafka Streams, the issues that we faced and the learnings we had throughout the process. We hope this can help others who want to use Kafka Streams for evaluating various streaming use-cases
Aggregations
An obvious solution to reduce DB calls is to aggregate for a set number of messages and make a single call
While this is conceptually correct there are a few issues while implementing this with hundreds of pods.
- Each counter update event can randomly end up at any of these pods, considering we have a large keySpace, the chance that we get two events with the same key in a span of a few hundred or a few thousand messages is small. In Fact we did try this initially and only saw a 10-20% reduction in writes.
- There can be cases where a pod randomly shuts down and we can lose all intermediate aggregation data. Depending on the semantics of the message queue as well as how we acknowledge messages; we will either lose or double-count data. This is unavoidable and will only increase with larger aggregation times
This is a problem that a lot of folks have had in the past. The solution for doing aggregations at scale is the classic map-reduce paper that came out of Google. It details that any such operation can be split into two distinct steps which can be repeated ad-infinitum
- Map :- Takes an input pair and produces an intermediate key,value pair which is more amenable to calculations. In our case we need to group keys by their <counterType,entityId>. This is the rekeying step. (entityId is equal to postId in most cases)
- Reduce :- Accepts an intermediate key and a set of values for that key. It merges together these values to form a possibly smaller set of values. For us this was the aggregation step.
Since we needed these updates in a streaming fashion, classic Hadoop Map-Reduce jobs were out of the question. We quickly decided on a few open-source streaming solutions and our main options were Kafka Streams and Apache Flink.
Both Kafka Streams and Flink work very well with Kafka. We wanted to test out how an inhouse Kafka deployment would perform as before this the team had never used Kafka at scale. We quickly spun out a few VMs and the tests were very encouraging. As we were sure we were going forward with Kafka as the message transport layer, Kafka Streams seemed like an easier choice for our stream processing needs. It was a library and unlike Flink we would not have to manage a full framework/cluster.
We decided not to evaluate any further but knowing what we know now we think Flink is also an equally good solution. In terms of feature parity, both Flink and Kafka Streams are almost identical for stream processing needs. There are differences in how these systems handle state and fault tolerance, which leads to different tradeoffs.
Windowed Aggregations in Kafka Streams
So now that we have decided on Kafka Streams, how does one map the steps detailed above to the actual code?
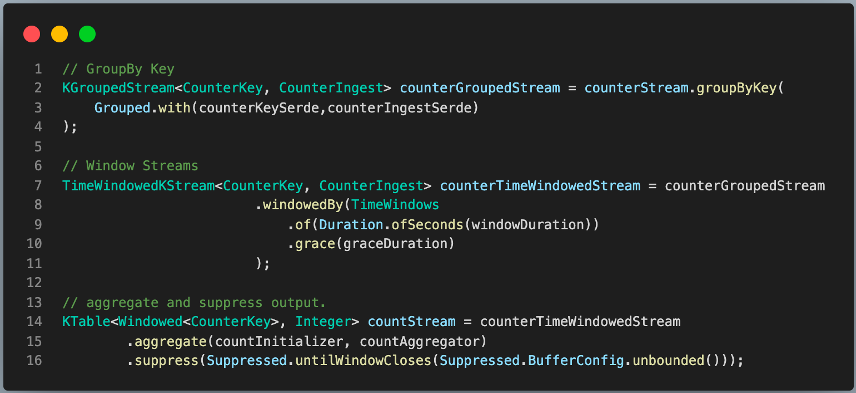
The core logic is pretty simple as we are using Kafka Streams DSL(Domain Specific Language) which hides a lot of the implementation specifics.
One thing that might seem different for folks who have not used streaming systems earlier is that we need to define our operations over a time-window. Keen eyed readers might also notice some strange terms like grace and suppress. We need to configure a grace period to help handle out-of-order events. We also need to suppress the output events in Kafka Streams as we only require the full and final aggregation output once the window is over.
And the Magic underneath…
The code above seems very simple and we claim to have solved both of the limitations that we had with in-memory aggregation(to a large extent).
To understand exactly why this is the case we need to go a bit deeper into how the streams DSL maps to the underlying topology
- groupByKey → In Kafka topics are divided into several partitions which each contain a subset of records. Kafka ensures that records produced with the same key end up at the same partition and by grouping a stream on the record key we are forcing a repartitioning based on the new record key.Since a single partition is only read by a single streams instance it ensures that all records which need to be aggregated together are processed together by the same streams task
- aggregate → Aggregates the values of records in this stream by the grouped key and defined windows. The result is written into a local WindowStore but these are backed by an internal changelog topic in Kafka. If a pod fails we can restore the intermediate data from the changelog topic. This is how Kafka Streams handles fault tolerance. Also we have the ability to write to a state store backed by RocksDB which ensures data is safely persisted to disk as well. While we do use RocksDB(It’s the default state-store in Kafka Streams) it is not especially useful to us as our pods are stateless. Hence we need to restore from the changelog topic.
There are some limitations here on how we commit offsets back to Kafka and by default Kafka Streams promises atleast-once processing(no records are dropped but there might be some duplication). Exactly-once processing is possible with Streams but we did not have a business use-case for it. It is something we can look to incorporate in future if the need arises.
Added Bells and whistles
We wanted to build a framework that can handle most counters use-cases in ShareChat. We tried to make a system that is extensible and provides extra features which compel people to migrate to it.
- Multiple Aggregation Intervals → We support a range of SLAs and also support different aggregation intervals for the same counter depending on the current count. This is important because if a post has less than 10 likes we would probably not want to aggregate, and instead directly update the likeCount in real-time. But for a post that already has millions of likes, a new like is not noticeable and we can have a healthy aggregation delay here.
- Triggers → One important feedback we got from many product teams was the need to send notifications to users based on milestones. This was a very good use-case for Streams as all updates for a single <counterType,entityId> pair are handled by the same pod. Thus we don’t need to worry about concurrency issues. This has been one of the most important features to help drive adoption for the framework.
- Counters-Meta-Service → We need to have bookkeeping for registering new counters, add new aggregation intervals, map counters to aggregation intervals and also maintain triggers. We have a separate service which manages this. It is a simple Spring Application backed by a MySQL database. To reduce calls to the DB we cache the data in both the streams job as well as the meta-service.
Operational Challenges and Learnings
We had a good vision of what we wanted to accomplish but it would be incorrect to say we got it working in the first try. The operations challenges with operating a large Kafka Cluster inhouse and monitoring hundreds of Streams jobs was a big learning experience.
I have tried to divide the learnings into a rough timeline to better detail the challenges at each state. Hope you find something to take away from this.
Getting Up and Running
A common thing that every Kafka user needs to decide is the number of partitions in a topic. One can find multiple blog posts on this on the internet. Some of these discuss limits on the max number of partitions in a cluster or the max throughput possible for a partition (Read Section on Partition Scaling) but usually most applications never reach the theoretical limit. Rather we feel it is better to determine the number of partitions by the number of consumers that you might require to handle your throughput. It is a much better heuristic for most practical cases.
Once we had the number of partitions figured out and had streams application running we encountered issues with streams consumer group continuously rebalancing.The consumer group would go into rebalancing as soon as we started the application and would never stabilize. We tried experimenting to check if there were some known timeouts that we could change, but the issue was still unsolved. We finally realized that the large number of rebalances were due to a delay in bringing up pods for a new deployment. By default when new members are added to a consumer group they trigger a rebalance. This can get worse for larger deployments(we initially ran 800 pods).This has been largely solved in KIP-134 which introduces the concept of adding a configurable delay to the initial rebalance of a new, or empty, consumer group. This can significantly reduce the overhead associated with starting up a stateful application. We noticed that configuring group.initial.rebalance.delay.ms parameter to a large value, usually 1minute or more, is helpful for reducing rebalances. The tradeoff is that after a deployment an user has to wait at-least 1 minute for the application to start processing new data.
Another thing that I would recommend is to have a good monitoring setup for Kafka. To start off with you can follow this excellent guide by Datadog. Once you have this set you can also look at having a good lag alerting mechanism. In addition to having a good observability setup I would recommend having tools and utilities like CMAK, Kafka Lag Exporter, Cruise-Control, KMinion to better manage and operate your clusters.
With this we were up and running in PROD and we were processing a large percentage of view-traffic in ShareChat.
Still we did not feel confident about the system.
We had occasional rebalances every few minutes which led to large consumer lag. While the system would almost always stabilize the data was delayed and we could not confidently quote SLAs or add more use-cases to the platform.
Rebalancing: Enemy of the State
You can never understand everything. But, you should push yourself to understand the system - Ryan Dahl
One might ask why are rebalances so important ? From what we have seen, the majority of issues with Kafka Streams(Consumer) are related to rebalancing. This is especially complicated as aggregations is a stateful operation and each streams task contains data that needs to be moved/restored across restarts and rebalances. This can lead to large delays in message consumption if we have too many of these. Operating a stateful stream processing application is more like operating a distributed database. So to understand and optimize for Streams performance one needs to understand more about rebalances.
Another thing that we decided pretty early was to measure our progress by observing a few key metrics.We decided to check on consumer lag as it is one of the best metrics to catch for issues in Kafka Consumers.
Coming back to the issue at hand and on Kafka Consumer Rebalancing protocol. A good introduction to this can be found in this wonderful talk at Strange Loop. While informative, this is an old video. The newest version of the protocol which is shipped with Kafka 2.4 and beyond is based on incremental cooperative rebalancing.
There is a lot of depth one can go into here but overall we wanted to optimize for two simple metrics/indicators (SLI)
- Reduce the number of rebalances
- Reduce the time required to restore state in-case a rebalance does happen
First let us focus on ways one can reduce the time required to restore state. Since we are not using persistent volumes we need to restore the entire state from the changelog topics.
This is a slow operation and initially there were cases where this took 20 minutes or more. While debugging we realized that the two sets of internal changelog topics were retaining data for much longer than expected
- aggregation state-store (cleanup policy :- compact,delete)
- suppression state-store. (cleanup policy :- compact)
The changelog topic for the suppression state-store was special as it was not marked to delete data periodically. Theoretically this seems fine as compaction should ensure that old data is overwritten in due time. Kafka Streams generates a tombstone record for each key when the aggregation window is complete. A tombstone record is special in that it ensures that any previous record with the same key is effectively overridden/deleted on compaction.
However what we observed in practice was much different. While compaction did happen the size of the topic still kept on growing. We had been running in PROD for around 2 months now and the size of the topics had grown to be in TBs. To combat this we did the following changes for all changelog topics
- Set the cleanup.policy to be compact,delete
- Set retention.ms to be 12 hours
- Set segment.ms to 4 hours and segment.jitter.ms to 1 hour
We did this as we wanted all data in change-log topics to be deleted after 12 hours. Also just setting the correct cleanup policy and setting retention does not automatically ensure that data will be promptly deleted after the retention period is up. Internally each partition in a topic is split into segments. This helps in improving performance but can lead to some counterintuitive behavior when it comes to setting retention policies. Simply put, segments are only ready for deletion or compaction if they are not the active segment and hence developers should ensure that segments are rolled over. We set ours to rollover every 4 hours and have a jitter of 1hour to avoid thundering herd.
We tried being more aggressive with these settings but saw some issues with our brokers on rolling over segments faster. Also with the current settings we have reduced state and storage(for changelog topics) by more than 100X and we can restore state in <1 min which is good enough for our use-case. Though this is a space where we know we can make more improvements in future if required.
After we had managed to tame the amount of state that we had, we shifted to the second problem to reduce the absolute number of rebalances.
To solve for this we first decided to identify why a rebalance occurs in the first place. Theoretically there can be three scenarios which can cause a rebalance
- A new consumer comes online and send a joinGroup request
- An existing consumer goes missing and is unable to send heartbeats for longer than session.timeout.ms
- A consumer is slow to process events and there is no response(poll) from the consumer even after max.poll.interval.ms
To help monitor these we set up a grafana dashboard to track metrics for our streams consumers. We did not have auto-scaling enabled so we needn’t worry about a new consumer coming online.
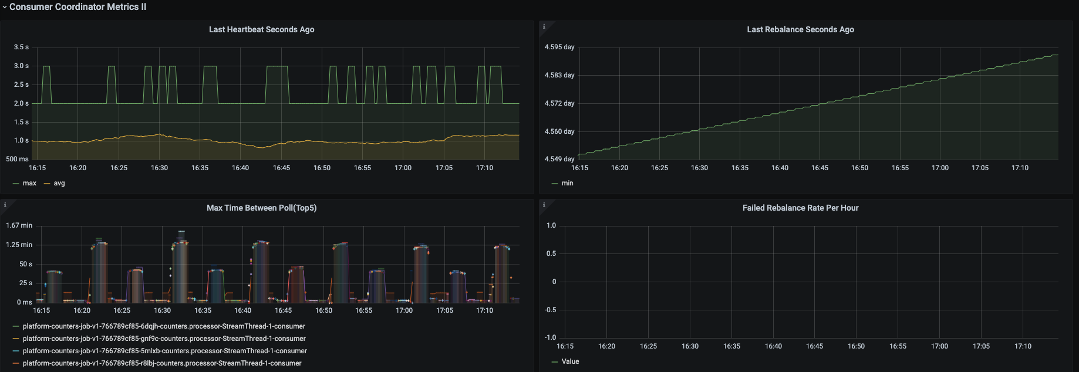
The actual dashboard has far more information and we set up a lot of streams, producer and consumer metrics to help learn more about the performance of our application. Initially there was a lot of noise in these metrics and it was difficult to discern issues but two things that we had observed
- there were times when the heartbeats would stop for more than the session timeout
- We saw a few OOM errors at around the same time of these issues.
Fixing the OOM issues was actually much simpler than expected. We were on OpenJDK 8 and used Flight recorder to investigate memory issues and GC pauses. We saw some GC stalls exceeding a minute, which would lead to the consumer protocol treating the pod as inactive/dead and thus triggering a rebalance. While it would be heroic to say that we fixed this all on our own by doing some awesome wizardry, the solution just involved updating to a more recent version of OpenJDK.
With the changes done the results were quite fantastic. We can now often go days or weeks without a rebalance(the picture above picked from PROD data shows the last rebalance was 5 days ago)
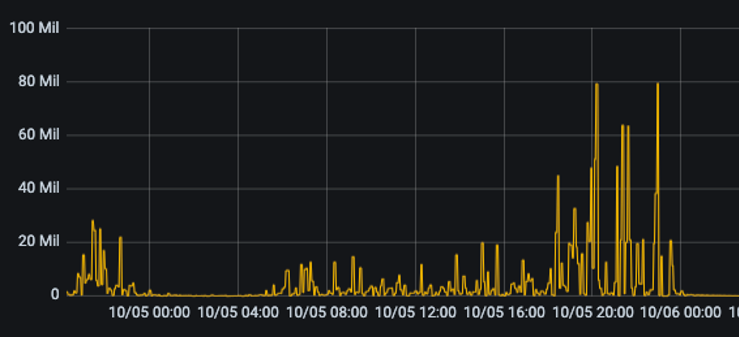
Below we can see that there is barely any lag and this is coming from where it would earlier go up to millions.
While the anticlimactic ending might not match the efforts, I cannot overstate when I say this that having a good monitoring setup and knowing more about the internals of systems is worth its weight in gold.
Harder, Better, Faster, Stronger
Daft Punk references aside, because of the work done on fixing rebalances we identified some improvements that we could do to our system to make it much more performant.
- Cost-Savings - After eliminating inefficiencies due to rebalancing we realized we were vastly overprovisioned. Stream processing applications should ideally be limited by CPU and we were barely touching 10-20% per pod. We managed to reduce the number of pods to 1/5 th the original number and even now we are overprovisioned.
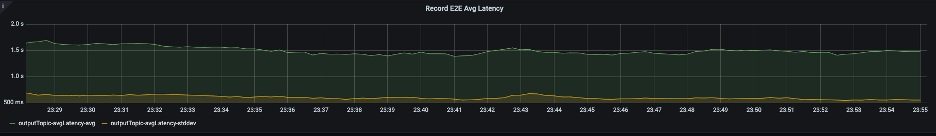
- E2E Latency Improvements - Another thing we realized from our monitoring setup was that the E2E latencies were pretty high for our streams topology. One reason for this was we had a repartitioning step which was not required as our ingest topic already has the correct key. Downstream tasks reading from a repartition topic can only read the data after it has been committed and thus for each repartitioning step we inadvertently introduce a delay equal to the commit-interval (30s by default for at-least once). This was quite surprising to us as this was not mentioned anywhere in the standard documentation. In addition to eliminating the repartitioning step we also changed commit.interval.ms to 1 second as our system could support committing faster..
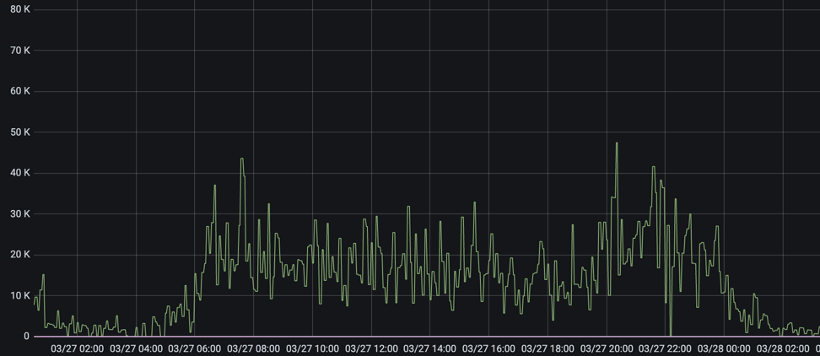
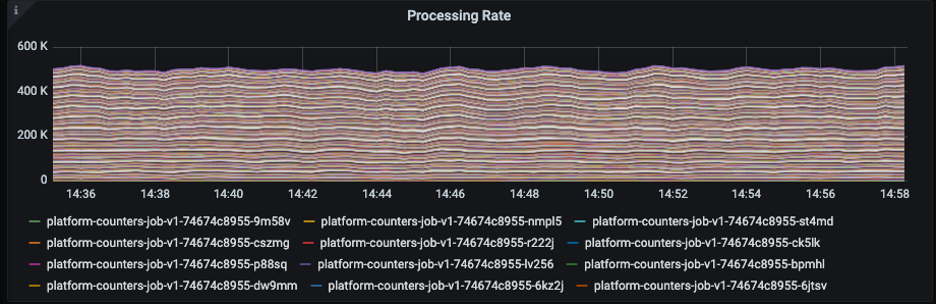
- Testing at 5x-10x current load - One way to simulate realistic load at 5x-10x the current numbers is to have a prod parallel cluster and simulate a large backlog. We did this by sending all the input data there and trying to update a dummy table. To make it more challenging for the system we tried to test 1s aggregations. These are even harder to maintain at scale because we are physically limited by the time taken to update the DB when we have smaller aggregation intervals (and thus more DB calls). The image below shows us processing 500k records per second with 500 pods at steady state. We can actually test for much more and have seen examples of processing at 1million+ events/sec on larger processing intervals in PROD when there is a large backlog after a deployment.
Concluding Remarks
In the end the project was a success and we continue to onboard more use-cases every week. The advantages provided by such a system are simple and help scale up our infra without incurring large costs.
For each new use-case we ensure that by onboarding to our system we can
- Handle the scale
- Lead to lower costs both at the DB level and ensuring we do aggregations better than ad-hoc implementations
- Avoid Hot Spotting as after aggregation the rate of update for a popular key is as good/bad as a normal one
- Provide monitoring and maintenance with easy integration
We are very confident that our solution can scale up to 10x our current traffic with minimal changes and with more traffic we have more changes for aggregation on updates and the system will help save even more.
Input/Output is ~7:1 leading to a more than 80% reduction in writes in PROD in Sharechat
What the future holds
We are currently looking to extend counters framework for more use-cases and evaluating
- Optimizing a deployment of counters for latency by eliminating internal caching in streams. We are evaluating this for some near real-time use-cases
- Support for more KV stores that are used internally in ShareChat
Support for Message Time Semantics. Currently we only support aggregations based on Processing Time.
Cover illustration by Ritesh Waingankar