Realtime Content Deduplication At Scale: How We Cut Cost By 86%
Andrei Manakov, Sanyam Gupta17 Aug, 2025

Why do we need the deduplication?
In one of our previous posts we explained how we reduced candidate deduplication during ranking cost by 90%, in this post we’ll explore a related challenge — real-time deduplication in stream processing.
Every time a user views a post, an event is fired to inform us. We feed this real‑time stream into our recommendation system, e.g. analytics pipelines, feature computations, and view counters. With more than 180M monthly active users, we ingest over three billion events per day and see peaks above 100k events per second. Unfortunately, client-side events are inherently noisy - duplicated events can arise as users scroll or navigate the app. Any duplicates in the raw stream introduce noise that degrades recommendation quality and wastes compute.
Our original content deduplication pipeline worked correctly, but memory and CPU costs ballooned as the volume grew. In search of a more economical solution, we migrated to Apache Flink and optimised each part of the pipeline, ultimately cutting our end‑to‑end cost by 86%. In the post, you’ll see how we made that happen.
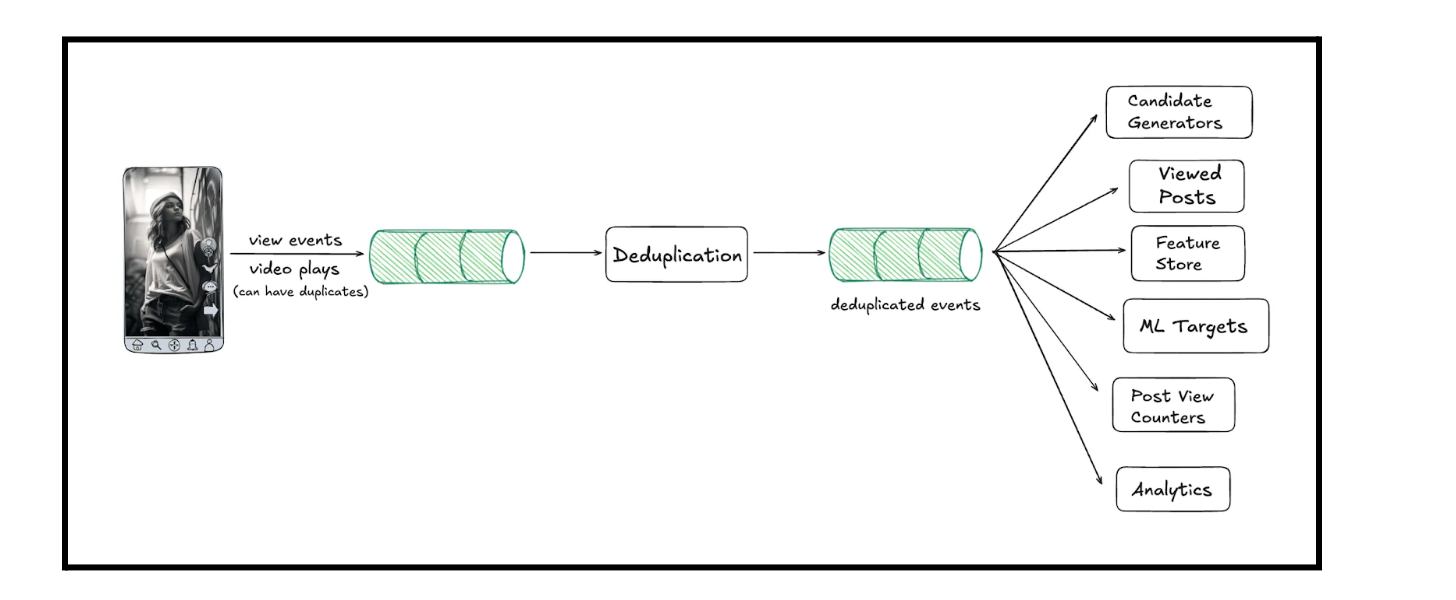
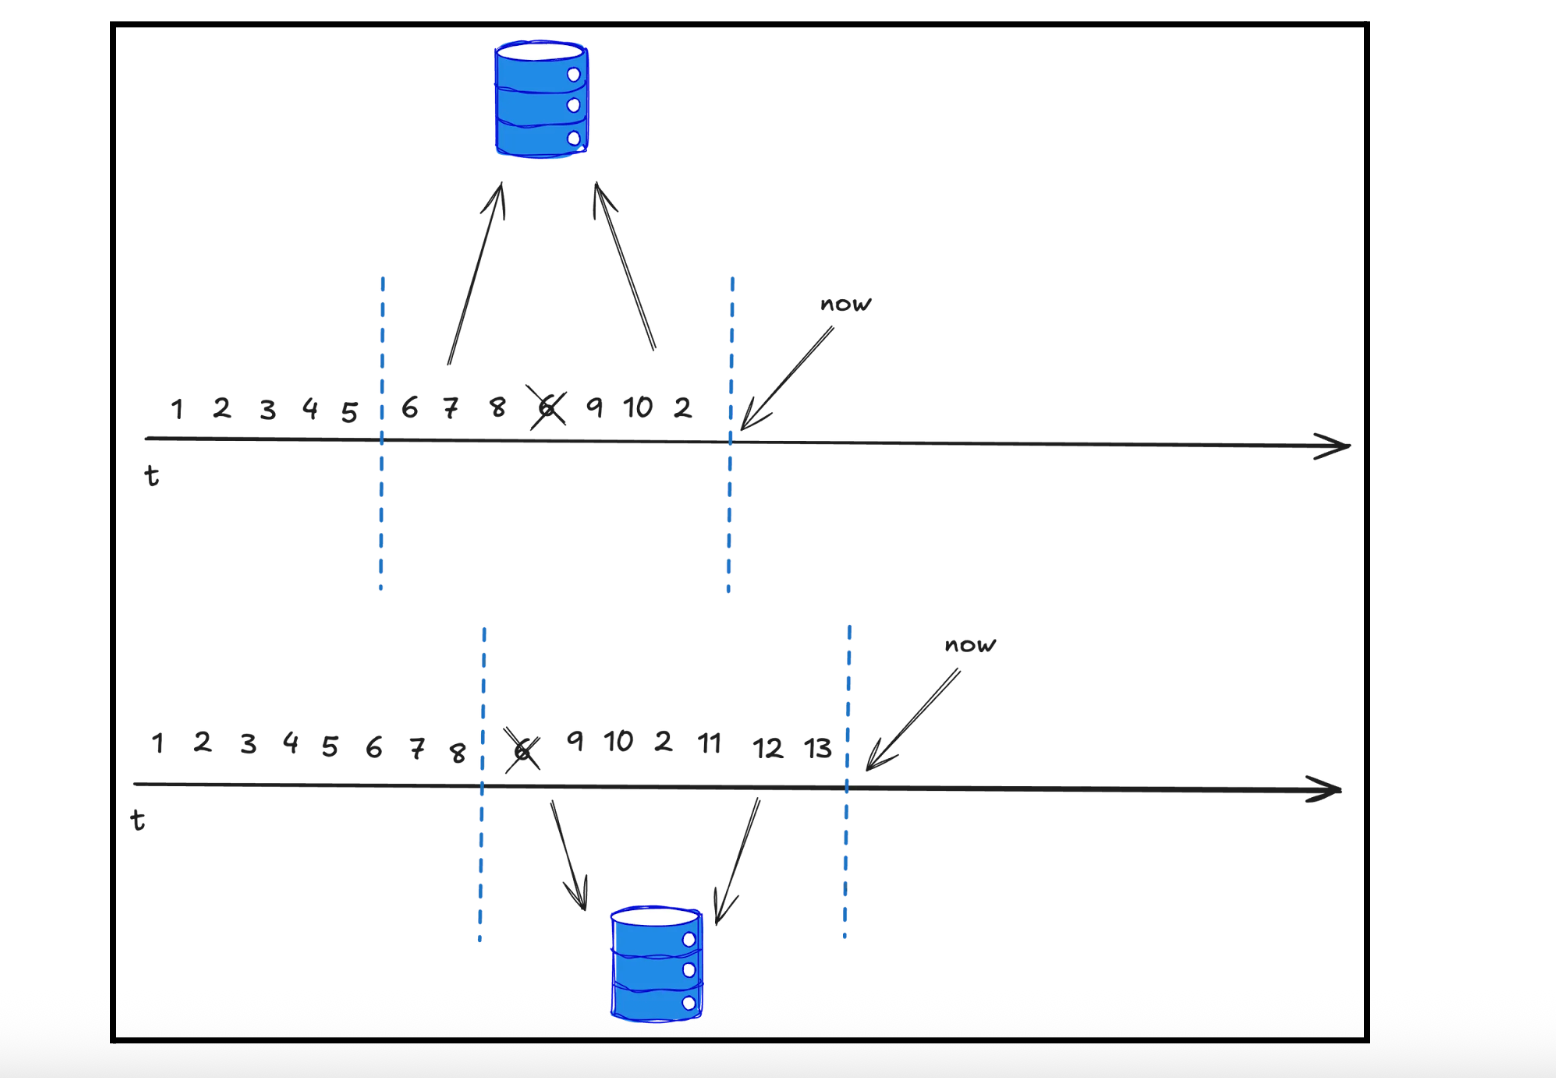
Our initial approach was a sliding window deduplication of events. For each event, we would check for the existence of a (userId, postId) pair within the window. If the pair already existed, we dropped the event.
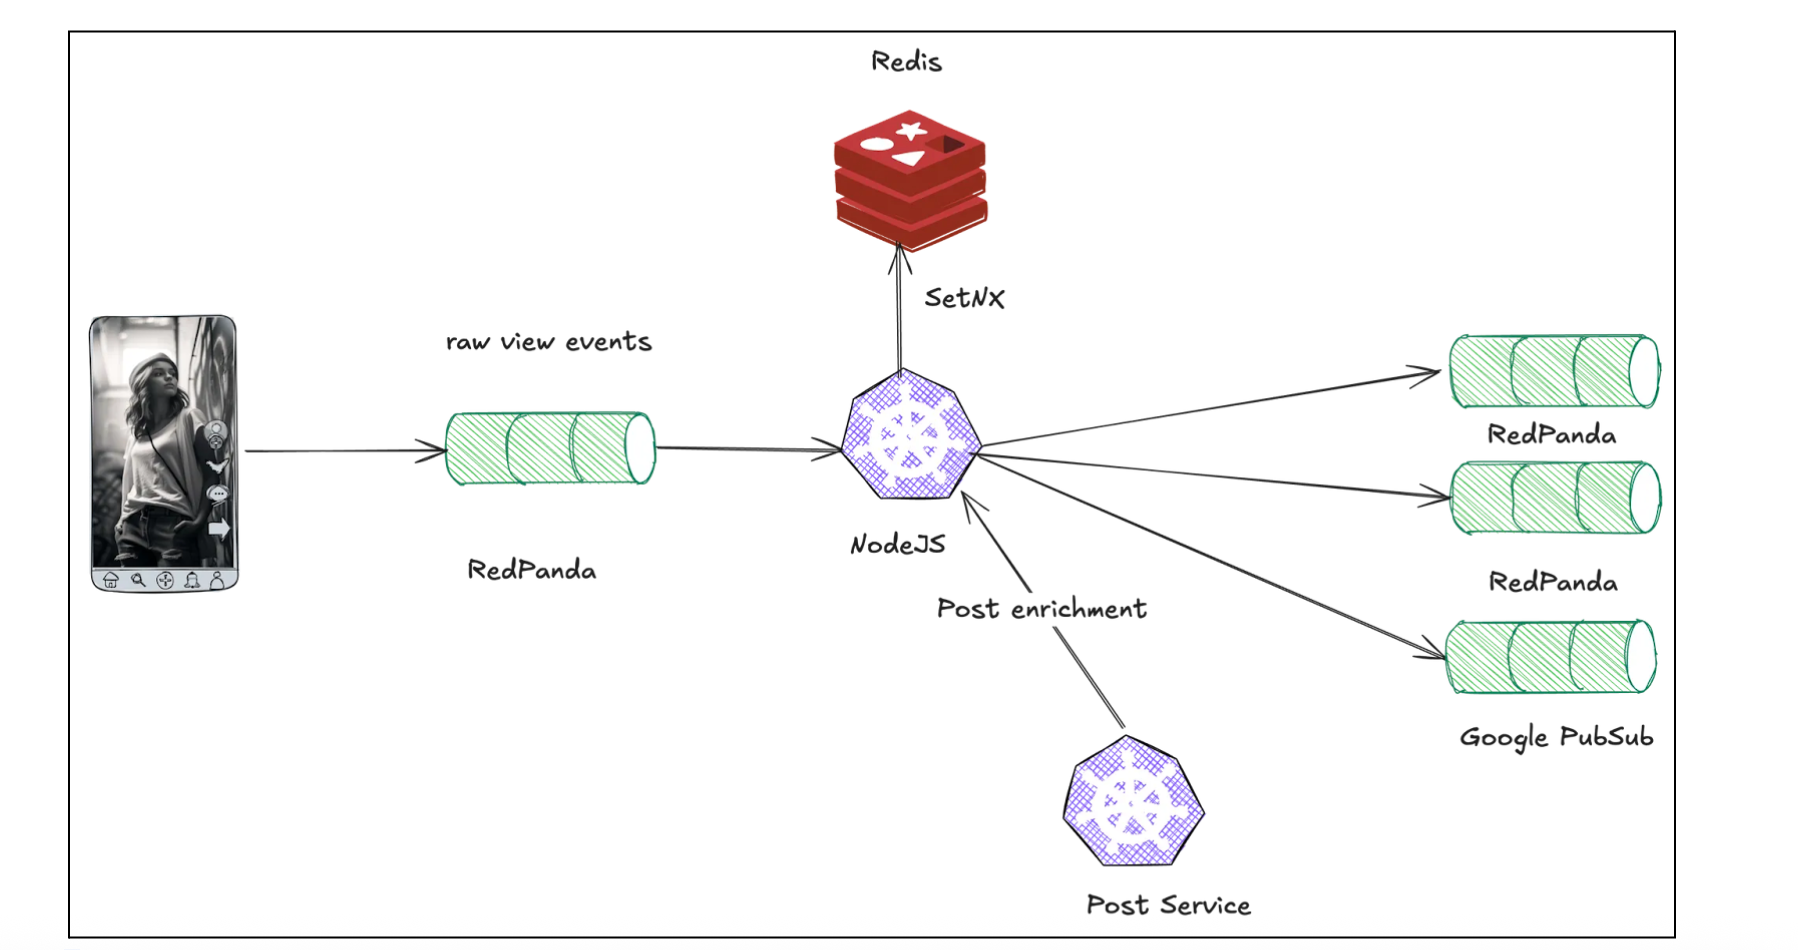
This processing logic was implemented in a Node.js job. It consumed events from a RedPanda topic, used Redis to store the (userId, postId) keys with TTL equal to window size via the SETNX operation (SET if Not eXists), and enriched unique events by calling an external post service for additional metadata (e.g., post language). Finally, it published the transformed events to downstream queues.
While this architecture was functional, it was not cost-effective. Node.js's single-threaded model is ill-suited for CPU-intensive stream processing, forcing us to overprovision compute resources. More significantly, storing the massive window of keys entirely in Redis memory was prohibitively expensive. This led us to re-architect the entire pipeline.
Choosing the right tools
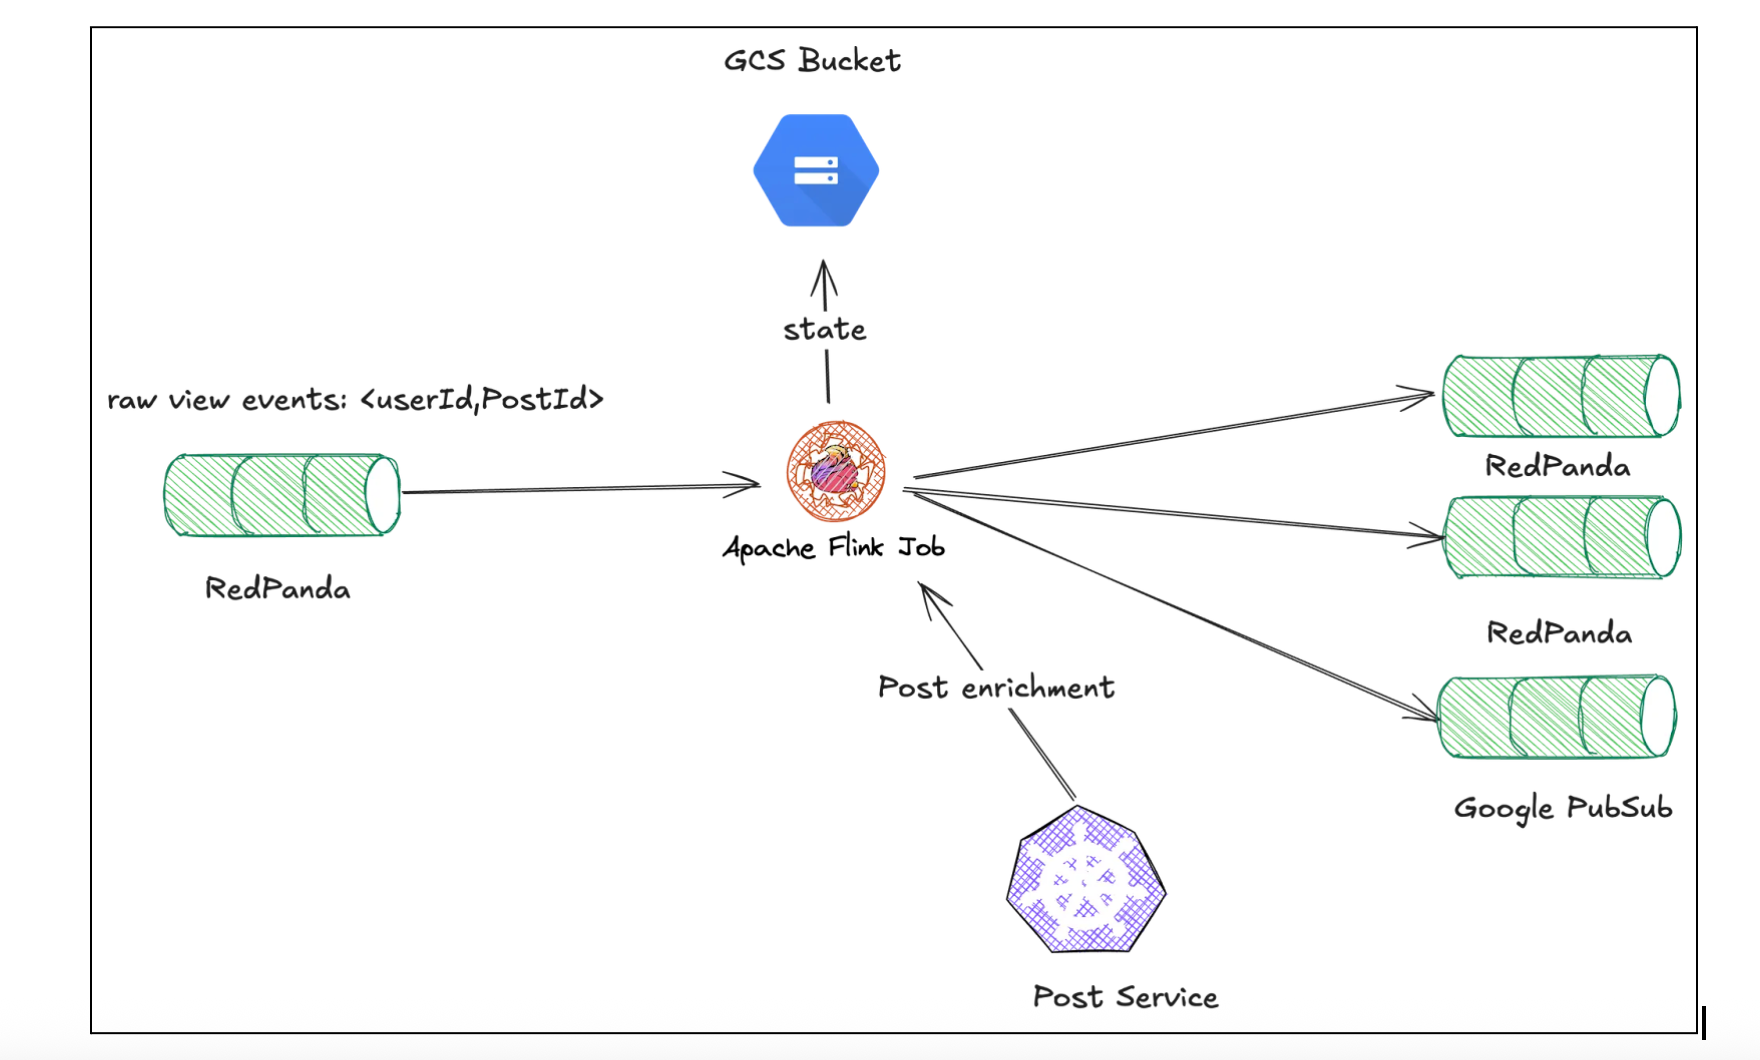
First, we re-examined the entire pipeline as a whole, questioning all original system assumptions and design choices. The high costs were a symptom of a fundamental architectural mismatch: we were using a generic stack for a classic stateful stream processing problem. This key insight allowed us to re-evaluate our tools. We decided to replace the Node.js and Redis setup with Apache Flink, a framework purpose-built for this workload and one we already use for our feature store.
💡More details on our Feature Store can be found here.
Flink offered two direct solutions to our primary cost drivers:
- Efficient state management - Apache Flink splits state between memory and local disk, with ability to create external backups. This approach is significantly cheaper than holding the entire state in redis memory and massively reduced our storage cost.
- Optimized compute - Apache Flink has been purposefully built for stream processing. Flink programs are inherently parallel and distributed, which is a stark contrast to single-threaded Node.js job we’ve used so far.
Adopting Flink was not a drop-in replacement. It introduced a new set of engineering challenges that formed the roadmap for our optimization work:
- How to manage a potentially massive Flink state without sacrificing stability?
- How to handle state loss during job restarts or deployments?
- How to perform external HTTP calls efficiently?
- How to enable autoscaling without re-introducing duplicates?
Flink State Optimization
In Flink, state is the data that operators maintain locally across events, enabling stateful operations like the sliding window deduplication we require. While the job is running, Flink keeps parts of the state in memory for fast access and spills the rest to a local on-disk RocksDB instance.
To provide fault tolerance, Flink periodically creates a checkpoint: a consistent snapshot of the entire job's state. This snapshot is written to durable storage (a GCS bucket in our case), allowing the job to recover exactly where it left off in case of failure. Job pauses some tasks during the checkpointing which might introduce a lag.
💡 More details on Flink State can be found here.
The initial state size was more than 200 GB which was huge. With such a huge state size, checkpoints take much longer, and the whole system becomes unstable as to usual processing stops. Therefore, we started looking into strategies for keeping the size manageable.
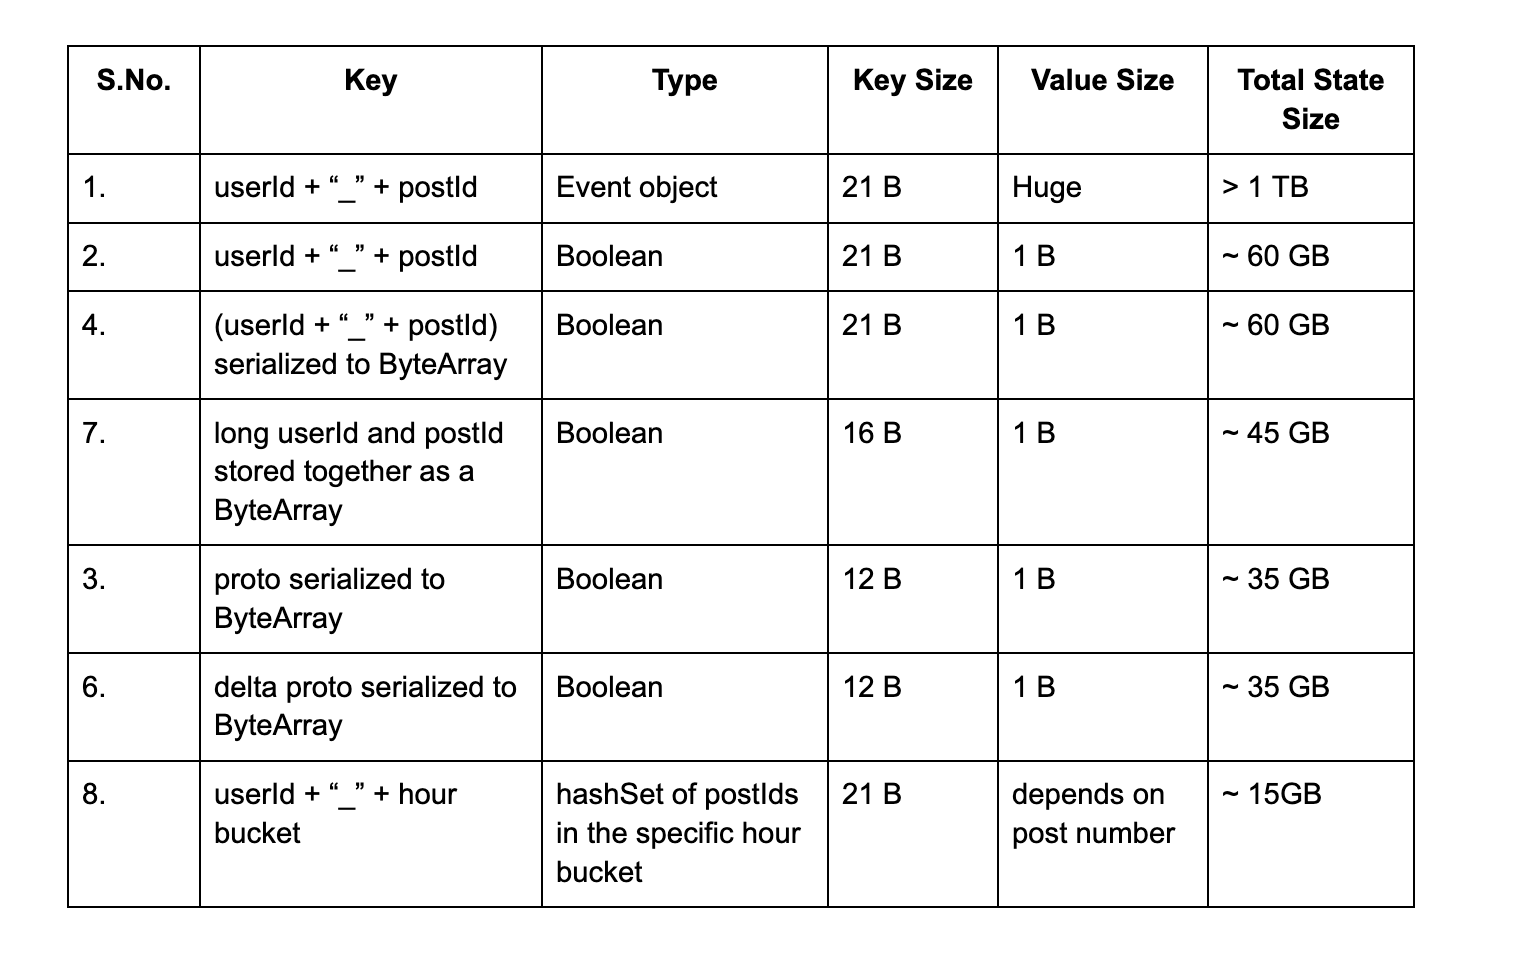
Since, Apache Flink does not support a native SetState, we were constrained to using MapState with dummy values to simulate set-like behavior, which influenced our design and serialization choices. Our initial hypothesis was that we could make the system stable by using a more compact key representation. We tested several serialization strategies:
- Initial attempt: Key → userId + “_” + postId , Value → Boolean
- State size quickly grew over 60 GB and job became unstable due to increased time for checkpointing. We did not keep it running long enough to populate the entire window but it would’ve exceeded 200 GB.
- Attempts at compression:
- Key → proto serialized to ByteArray, Value → Boolean
- Key size ~ 12 bytes
- State size > 35 GB
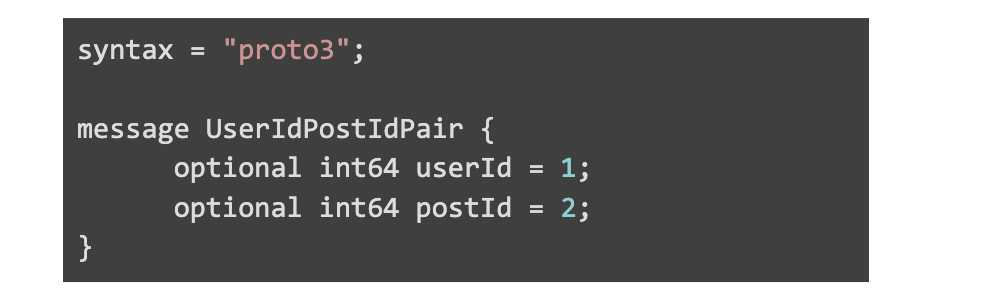
- Proto file
- Key → proto serialized to ByteArray, Value → Boolean
- Key → (userId + “_” + postId) serialized to ByteArray , Value → Boolean
- Key size ~ 21 bytes
- State size of: 60 GB
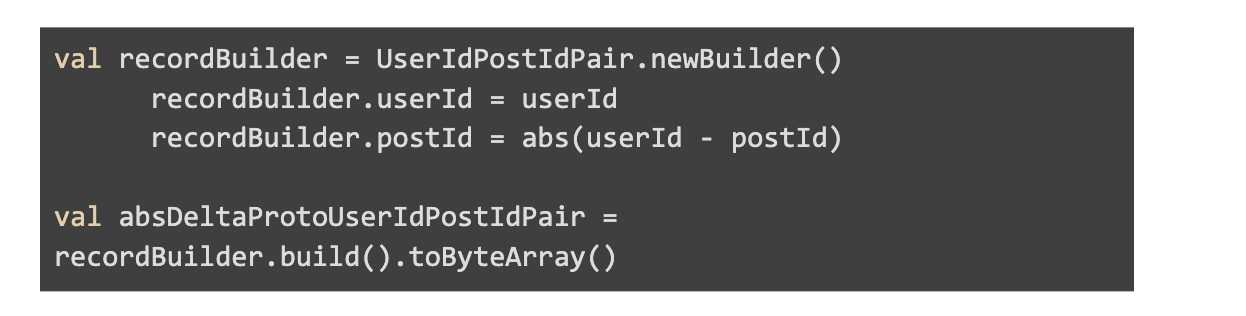
- Key → proto with delta based compression (having postId stored as the absolute difference of userId and postId) serialized to ByteArray, Value → Boolean💡More details on Delta Based Compression can be found here.
- Key size ~ 12 bytes
- State size: 35 GB
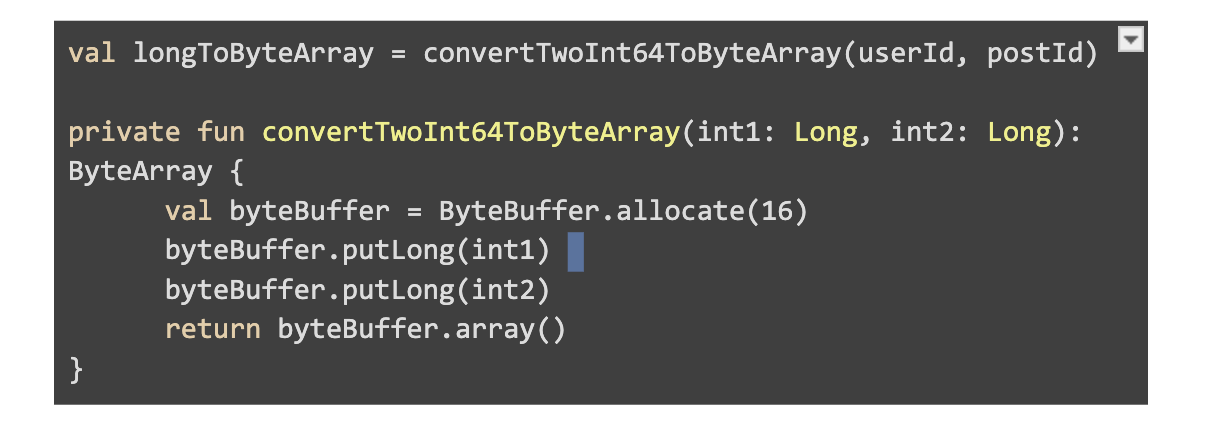
- Key → long userId and postId stored together as a ByteArray, Value → Boolean
- Key size ~ 16 bytes
- State size of → 45 GB
While these compression techniques provided a significant 4-5x improvement, the job's stability was still not satisfactory. Checkpoints were slow, and the system was sensitive to traffic spikes. We realized we were hitting the fundamental limit of the key-centric model itself: with billions of events, we would always have billions of individual state entries.
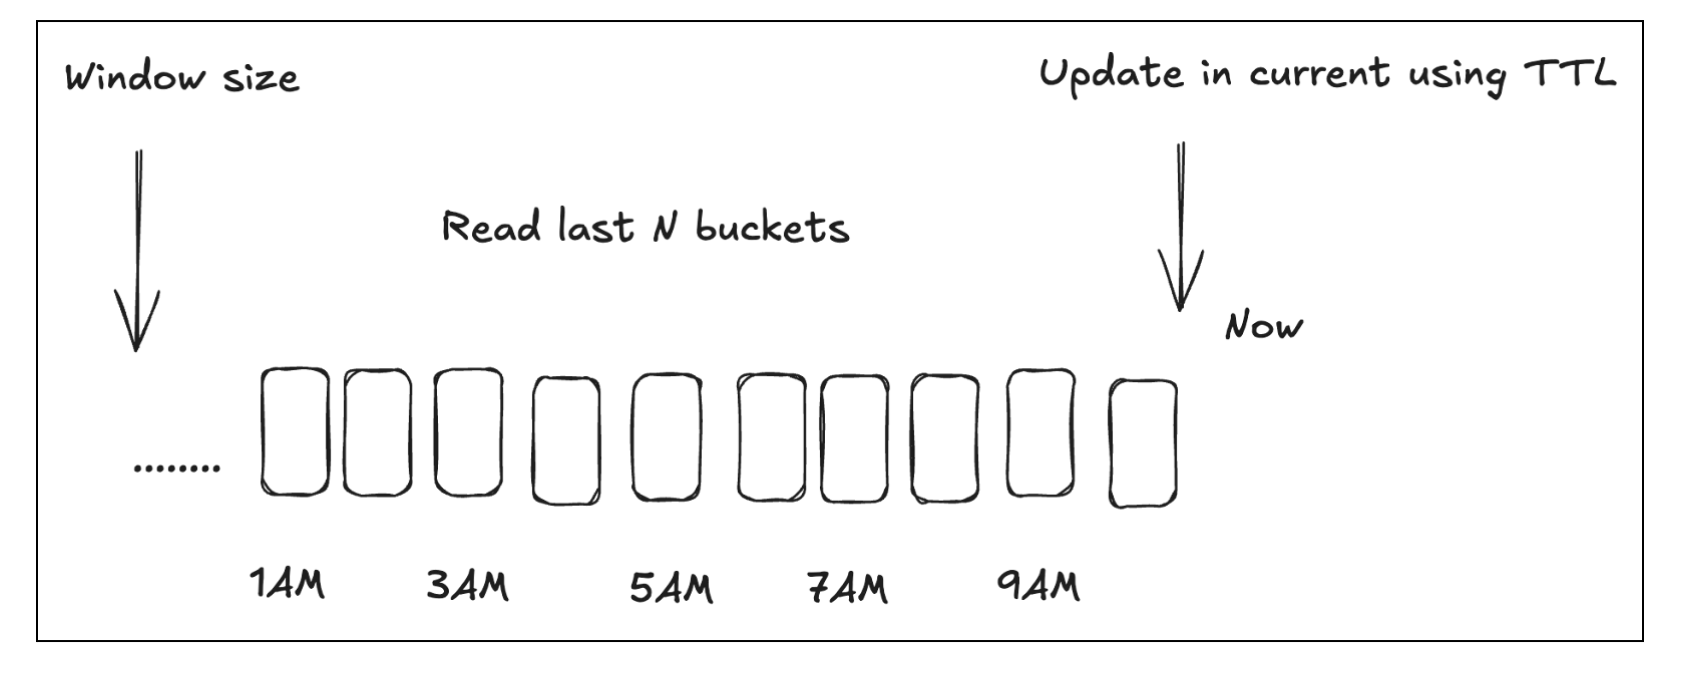
This led to a shift in our thinking. Instead of optimizing each individial key, what if we changed the data model? We decided to keep userId as key with post Ids in values. As result, we stopped storing userId for every event and reduced allocated bytes. While this allows us to vastly decrease the state size, we are losing the ability to set TTL on each key. In order to support gradual data expiration we included hour bucket to the key as well.
- Key:
userId_<hour> - Value: hashSet of postIds
When a new event arrives, we check the recent history by reading the last N buckets. If we have not seen it yet, it is added to the current hour’s bucket.
This allowed us to drop the size of the state to ~15GB, at which point the job was stable.
Result
The final model, grouping posts by user-hour, provided the smallest memory footprint and resulted in a stable job. The journey from our initial, naive implementation to the final design highlights the dramatic impact of data modeling on stateful streaming performance.
Below is a summary of all the options considered:
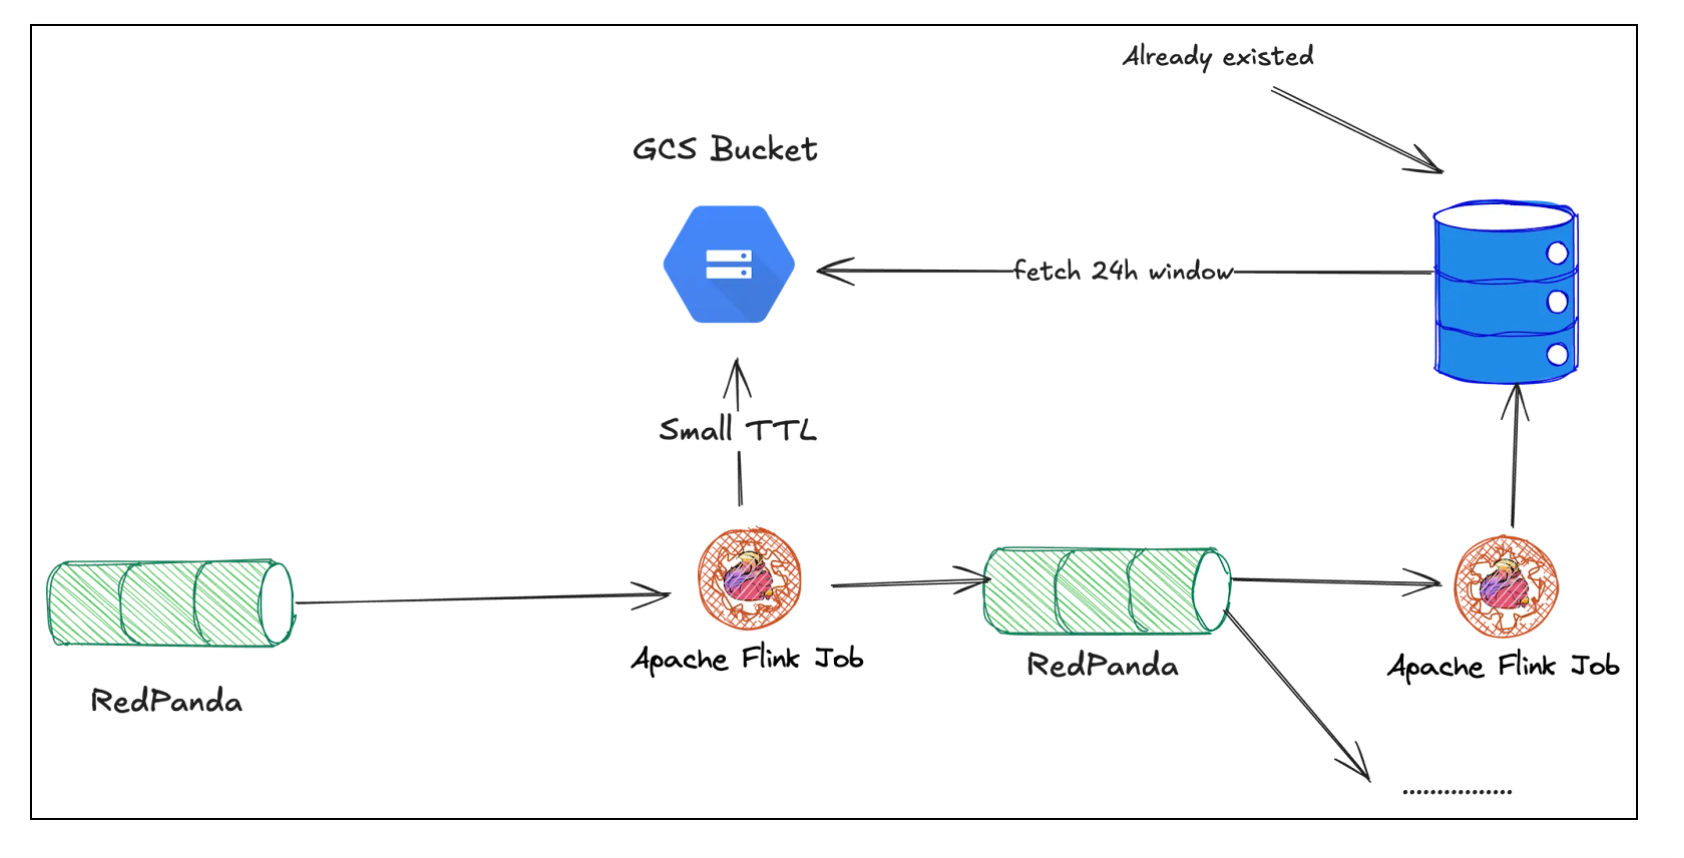
Restoring State from an External Database
At this point, the job became very smooth and stable because the state size was manageable. However, during testing, we realized that any changes to the structure of the computation pipeline altered the job's internal state structure. As a result, we couldn’t restore the job from its previous state. During a stateless deployment (starting from a clean state), all events previously saved in the state were lost. This meant that duplicates (in terms of the userId+postId key) would increase whenever such a deployment took place.
The solution to this problem was to use external storage for the last 24 hours of post data. At this point, we realized that we already had the user view history and could reuse it. We wrote more details about this in a previous post. Querying the external database for each input event would generate too much throughput on it, thereby increasing the database cost. However, we could query it only if the Flink state didn’t have the view history for a specific user. Therefore, we decided to use Flink state with a 2-hour Time-to-Live (TTL) to store all unique events encountered in the last 24 hours. This state would be populated from the external database when processing an event for which the state was empty for that user. Since the state is not empty most of the time, the additional load on the external database was tiny. In a way, the Flink state would serve as a cache, while the external database would be the source of truth.
💡The previous post can be found here.
Note: The output of this system goes to a Redpanda topic. One of the consumers of this topic is another system (a Flink job which is mentioned in the previous post) that populates the external database mentioned above.
Post Enrichment
At this point, the job worked efficiently and performed deduplication correctly. However, we needed to provide additional fields in the output events, which was only possible by calling an external HTTP service. These additional fields are required by a couple of consumers of the deduplicated events. Why is this a problem?
In Apache Flink, we have a fixed level of parallelism, controlled by the number of task slots and TaskManagers. TaskManagers are responsible for executing tasks. Each task runs in parallel, and this model works great for CPU-intensive workloads, where tasks actively use the CPU to process data. But when each task makes external HTTP requests, we began to see obvious problems: most tasks were stuck on network I/O. The number of TaskManagers increased to handle the parallelism because Flink thought we needed more resources. However, CPU usage per TaskManager actually dropped because tasks were mostly idle, waiting for API responses.
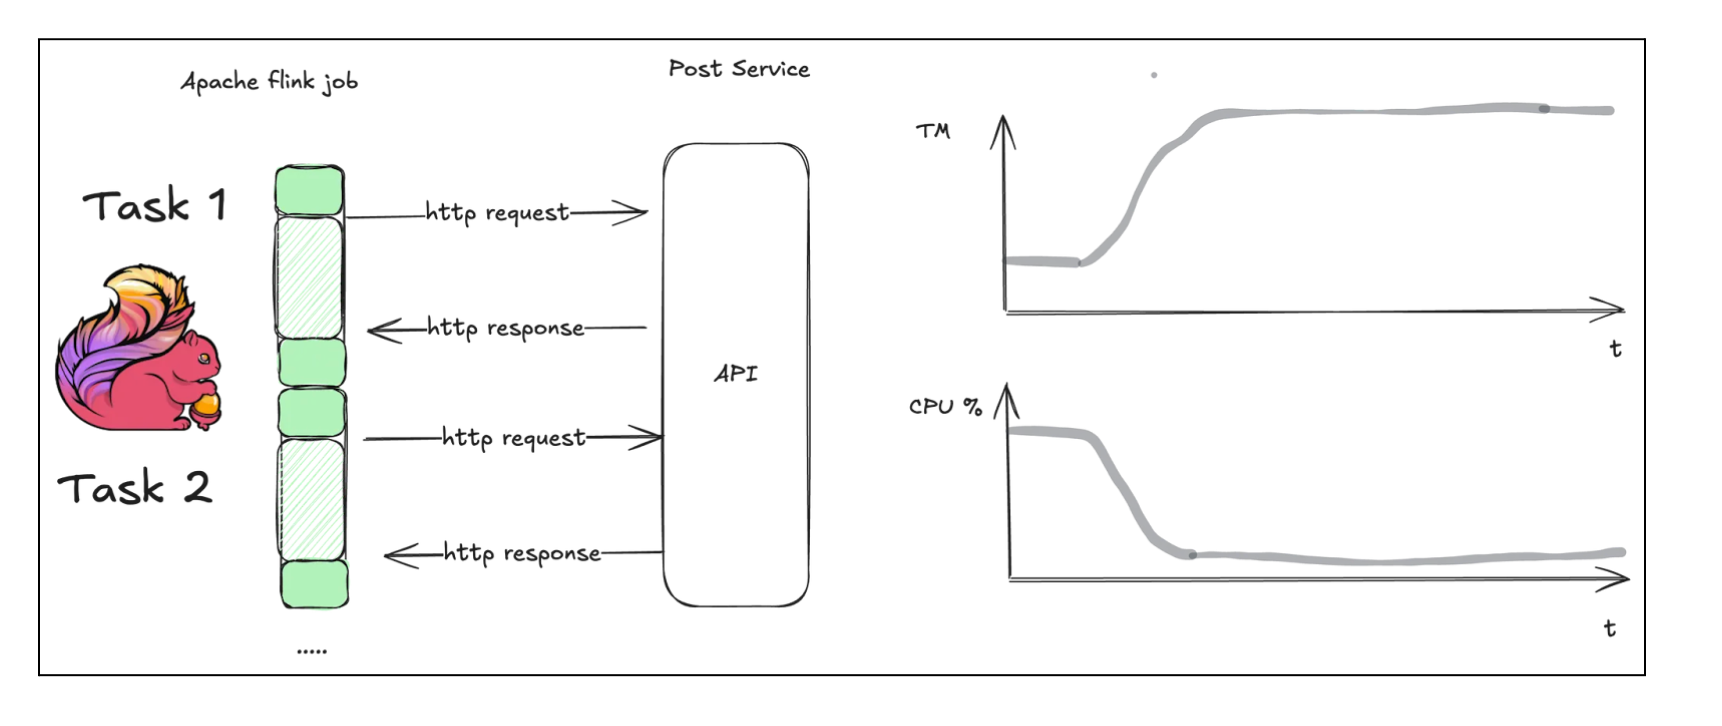
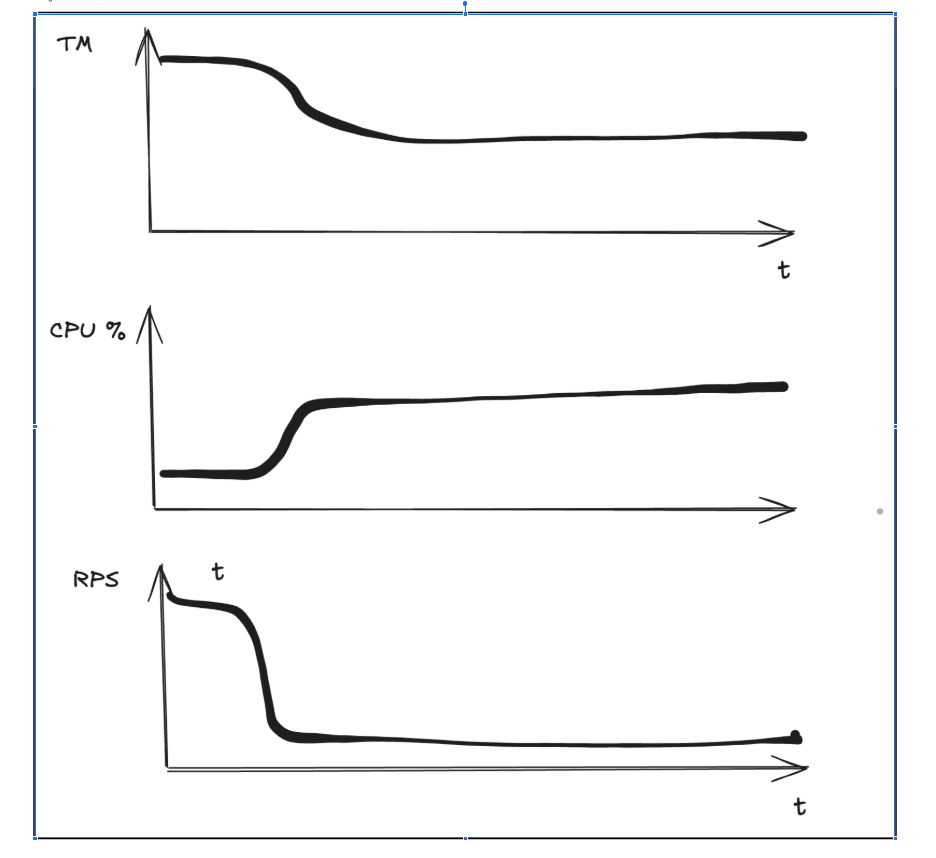
So, to reduce this wastage, we needed to either decrease the number of HTTP requests or send requests in parallel within a task without requesting additional TaskManagers. As the simplest solution, we decided to start with caching post fields in our existing state. It turned out that even with a small TTL, the cache hit rate was greater than 95%. Consequently, resource wastage dropped significantly, and this was a good enough solution for us.
But what’s next? How can we optimize it even further? We considered two additional optimizations:
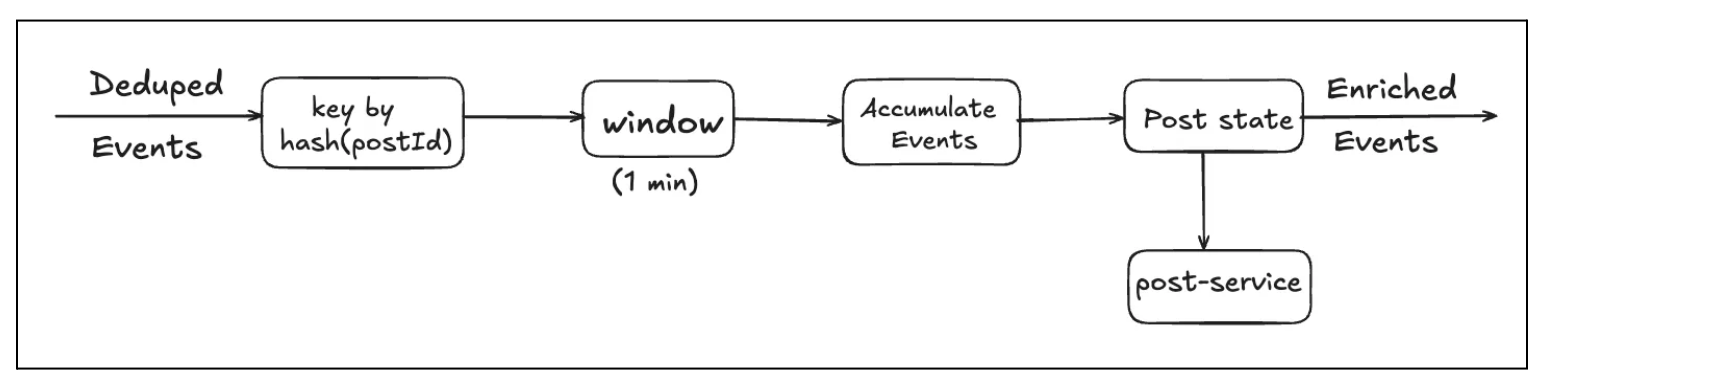
1- Batching events so that a single call to post-service can fetch data for multiple events. This would require a change in the pipeline and introduce additional windowing.
💡More details on windowing can be found here.
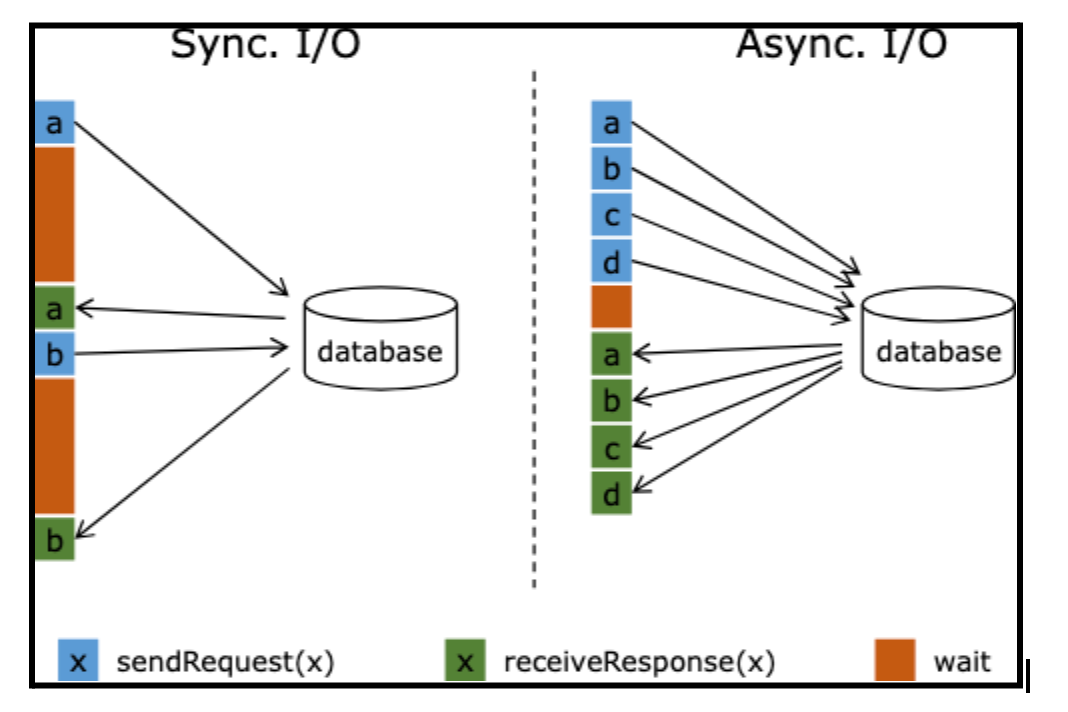
2- Making multiple HTTP requests in parallel using just one task slot. In this case, a task would make all calls in parallel, and wastage would be reduced even further. This can be implemented using Flink Async I/O.
💡More details on Flink Async I/O can be found here.
We ended up deprioritizing these optimizations because, after all the previous enhancements, the cost had already dropped by 86%, as mentioned earlier. However, we plan to implement them later, as this could lead to at least an additional 2x cost reduction. It is no longer such a significant cost component for us.
Kubernetes Autoscaling
The throughput of the source event stream changes throughout the day with variations in the number of users on the platform. Until now, our Flink job always ran on a fixed number of resources (TaskManagers for each operator). These resources were set based on the peak traffic time of the day. Consequently, the job was over-provisioned most of the time.
To solve this, we wanted to enable autoscaling of TaskManagers for each operator in our Flink job. This would also provide some cost savings. We decided to leverage the Flink Kubernetes Operator for this.
The Flink Kubernetes Operator is a Kubernetes controller that:
- Manages the full lifecycle of Flink jobs (deployments, upgrades, restarts).
- Supports Reactive Autoscaling
💡 More details on Flink Kubernetes Operator can be found here.
The operator provides job autoscaler functionality that collects various metrics from running Flink jobs and automatically scales individual job vertices (chained operator groups) to eliminate backpressure and satisfy the set utilization target. By adjusting parallelism at the job vertex level (in contrast to job parallelism), it can efficiently autoscale complex streaming applications.
The autoscaler relies on metrics exposed by the Flink metric system for individual tasks. These metrics are queried directly from the Flink job.
Key factors in Autoscaling-
- Busy and backpressured time at each job vertex
- Idle time at each job vertex
- Backlog information at each source
- Incoming data rate at the sources (e.g. records/sec written into the Kafka topic)
- Record processing rate at each job vertex
Note: Container memory/CPU utilization metrics are not directly used here. High utilization will be reflected in the processing rate and busy time metrics of individual job vertices.
Result
Enabling autoscaling for our job resulted in 30% compute cost savings.
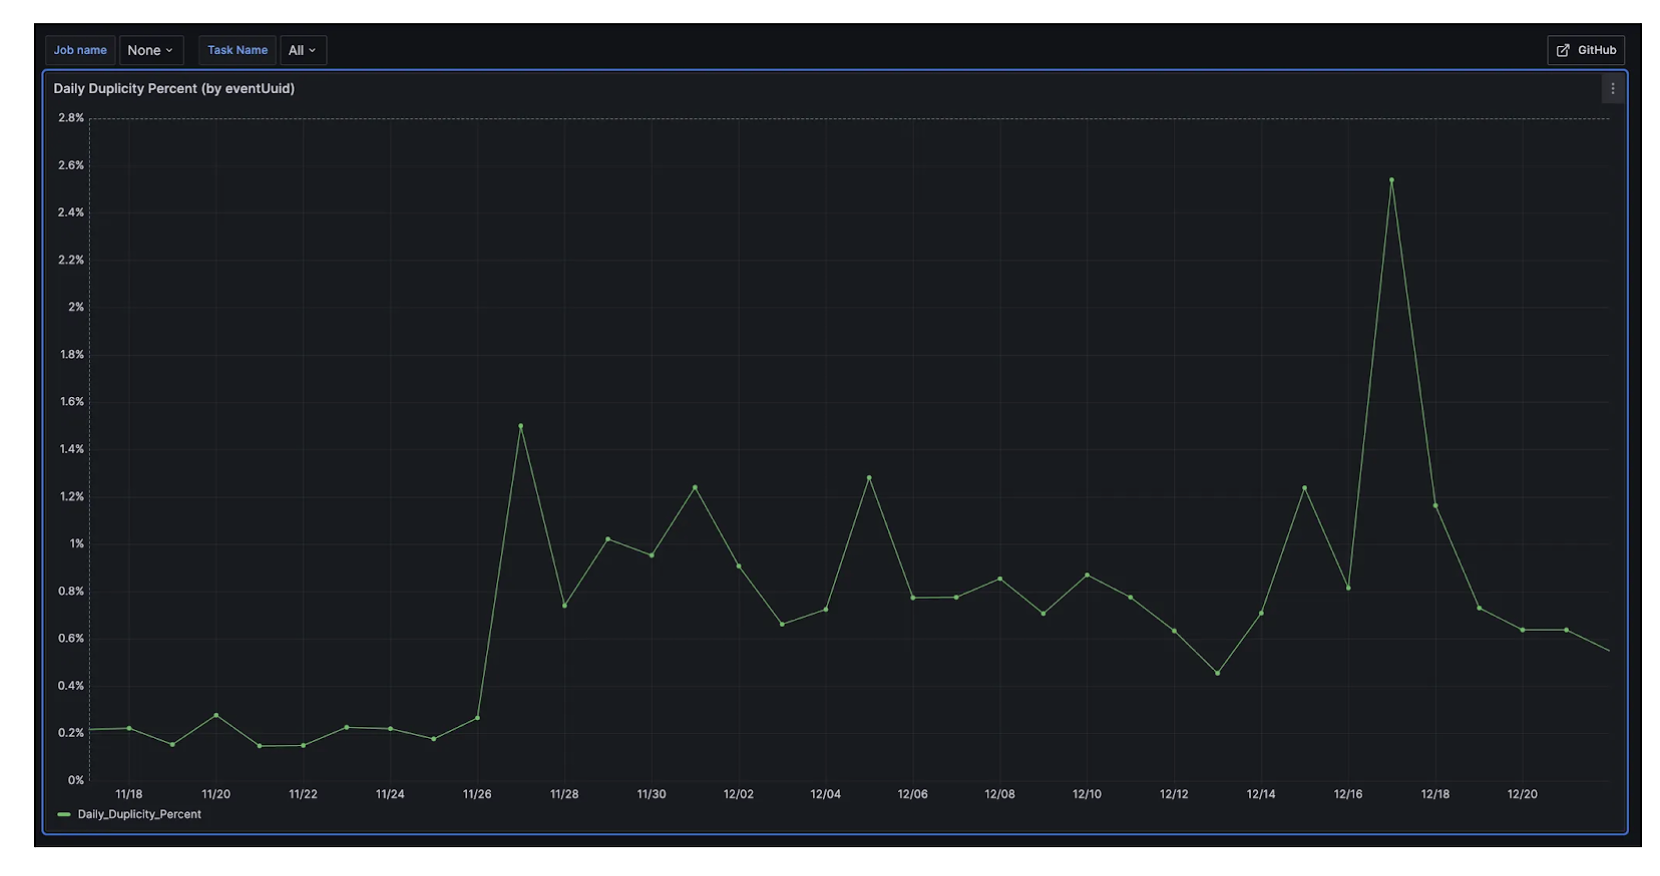
Duplication Increase
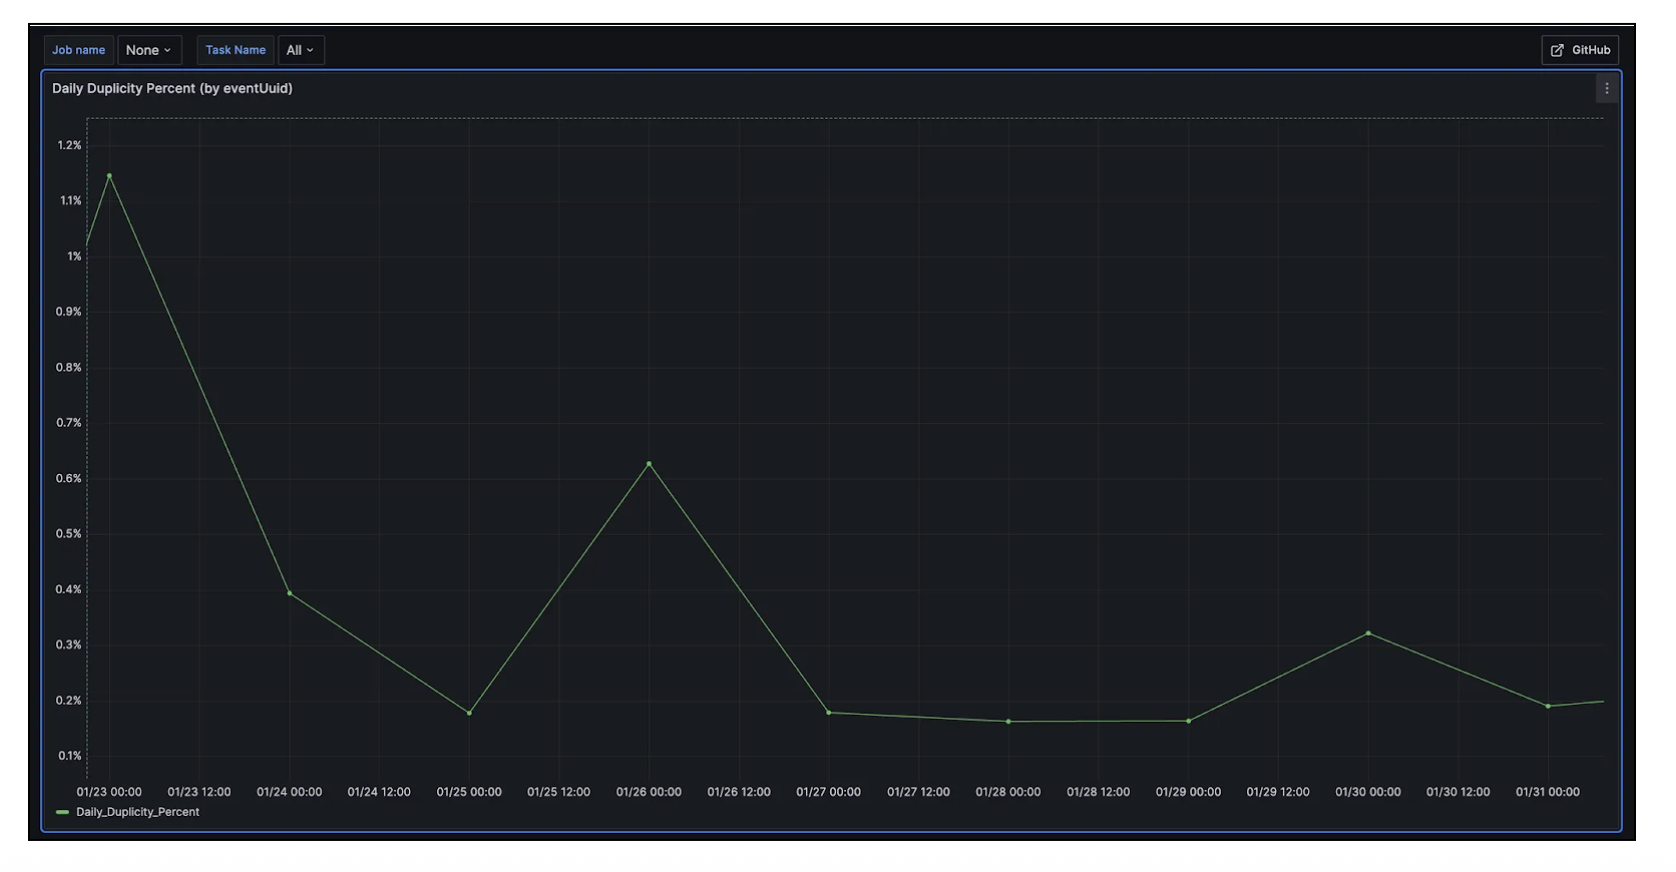
Upon enabling autoscaling for the Flink job, around 1-2.5% daily duplication increase in View Events Streams.
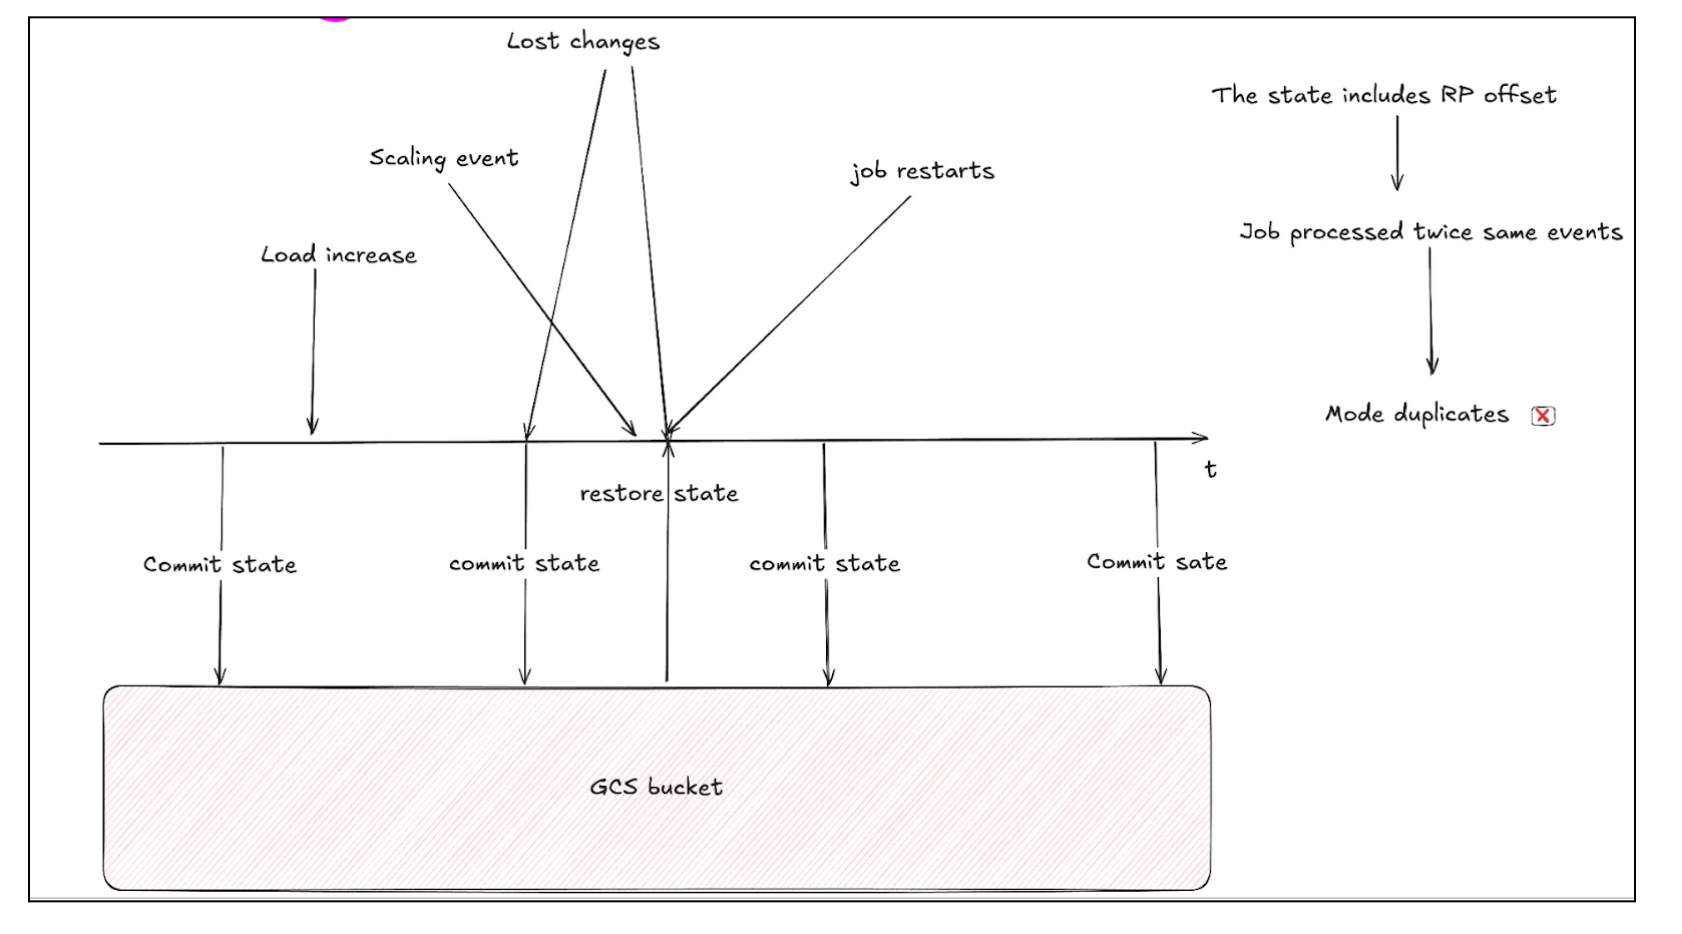
The reason for this increase in duplicates was as follows:
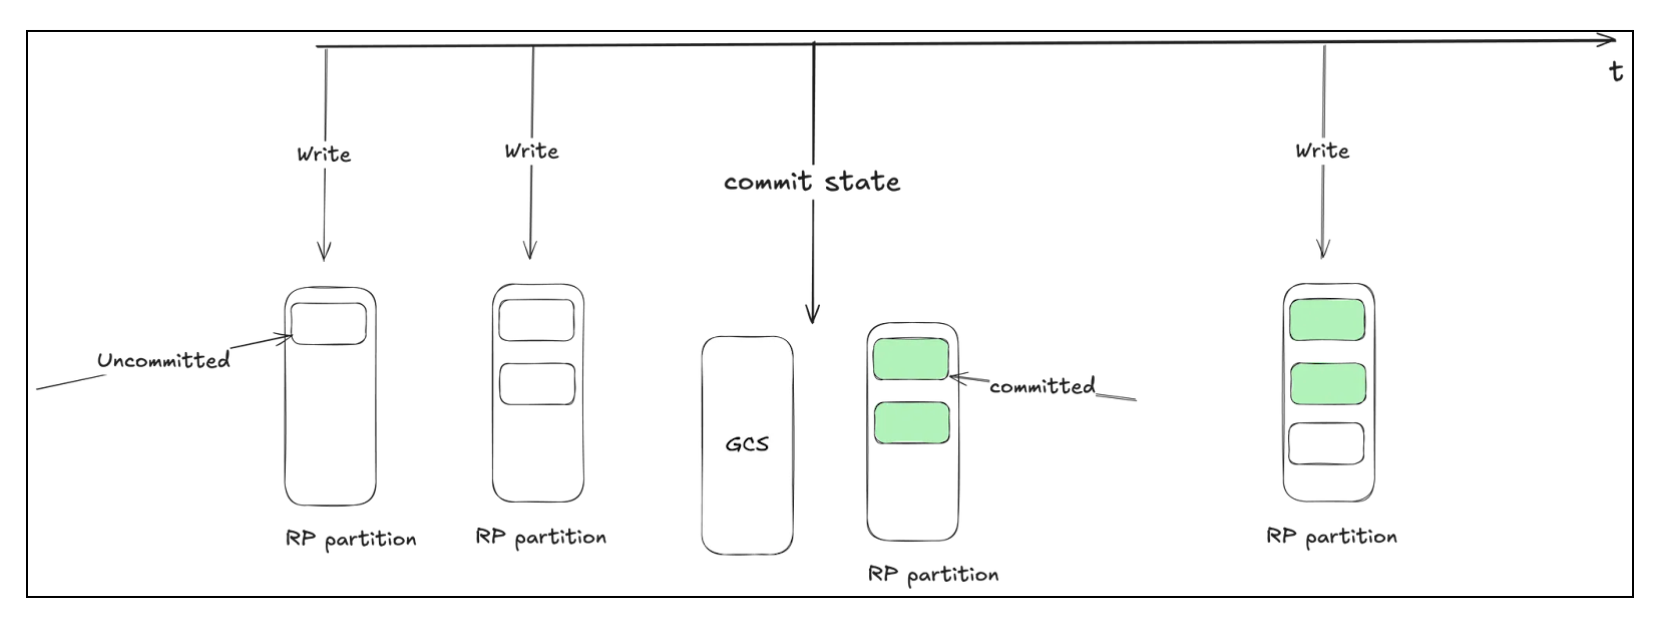
- The job saved (committed) Redpanda source offsets in its state, which was persisted to disk during checkpointing.
- During any scaling up/down event or restart, Flink restores state from the last successful checkpoint.
- That checkpoint includes the Redpanda offset, which might be outdated because newer data was already processed after the checkpoint was taken. So, when the job restarts, it replays the same events again.
Thus, they are written to the sink Redpanda topic twice. This gives rise to duplicates.
Solution
The solution to this is to commit the offsets during checkpointing and write the event to the destination Redpanda topic as a single, atomic operation.
This is exactly what Redpanda transactions allow. They enable us to achieve Exactly-Once Processing.
Producer Configs to Enable Transactions in Redpanda along with Exactly-Once Processing -
- Transactional Id → This property acts as a producer identity. It enables reliability semantics that span multiple producer sessions by allowing the client to guarantee that all transactions with the same ID have completed prior to starting any new transactions.
- Delivery Guarantee → Ensures delivery semantics for messages. Should be EXACTLY_ONCE. Other possible values are AT_LEAST_ONCE and NONE
Consumer Configs to Read COMMITTED Messages -
- Isolation Level → Should be set to READ_COMMITTED to read messages that have been marked as committed through transactions. By default, consumers read uncommitted records.
Enabling transactions didn’t lead to any computational overhead in Redpanda. You can read more details about transactions here.
Result
The number of duplicates reduced, and they returned to the usual levels observed before enabling autoscaling.
Multi-Zone Redpanda → Single-Zone Redpanda
Once we finished optimizing the job itself, we looked at the next biggest cost component: the Redpanda cluster itself. Given our previous experience, we were not surprised that more than 80% of its cost was coming from inter-zone traffic. Both the RedPanda cluster and Apache Flink were deployed across multiple zones. In our case, we were willing to sacrifice availability for a short period in the event of a catastrophic zone failure. So, we switched both the Apache Flink job and the Redpanda cluster to a single zone. As a result, the Redpanda cluster cost dropped by 84%
Conclusion
Infrastructure Cost Savings
Prior to the migration, the cost allocation by component was as follows:
- State Storage: 29% of the total cost.
- Job Compute: 10% of the total cost.
- Redpanda: 61% of the total cost.
We achieved significant cost savings from this migration. These savings resulted from the following factors:
- Replacing Redis (used for state storage) with Apache Flink reduced state storage costs by 99%.
- Replacing Node.js with Apache Flink reduced compute costs for this component by 50%.
- Moving Redpanda to a single zone reduced its cost by 84% by eliminating inter-zone traffic
The overall infrastructure cost dropped by 86%.
Performance Improvements
- The Redis instance used for deduplication in the Node.js job was a single point of failure. It often came under stress during high-traffic events such as festivals and New Year celebrations. In the Flink job, deduplication is performed using Flink's state management and is handled through job autoscaling.
- Manual upscaling of Redis was required before high-traffic events. This is no longer the case with the Flink job.
- Reliability and availability increased with the Apache Flink job.